Prepared by: Openzeka Teknoloji A.Ş. — Official Embedded Compute Distributor for NVIDIA Türkiye & MEA, and NVIDIA Elite Partner
Test platform: 1x / 2x / 4x NVIDIA DGX Spark (GB10) · Model: Qwen3.6-27B-NVFP4 · Report date: July 2026
Contents
- 1. Introduction and Test Methodology
- 2. Results
- 3. Scaling Efficiency Analysis
- 4. Technical Deep-Dive: Why Ethernet Tensor Parallelism Works on GB10
- 5. SLO-Driven Capacity Planning
- 6. Deployment Topologies: Tensor Parallelism vs Replication
- 7. Accuracy: NVFP4 vs FP8
- 8. Limitations and Future Work
- 9. Conclusion
- Appendix A: Per-Configuration Charts
1. Introduction and Test Methodology
1.1 Motivation
Our previous study, Qwen3.6-27B DGX Spark Benchmark, compared quantization formats (FP8, AWQ, NVFP4) and MTP configurations of the same model on a single DGX Spark. This report answers the natural follow-up question:
What happens when you add more DGX Sparks? Does a 27B model get faster when sharded across 2 or 4 machines — and by how much? And when is scaling out with tensor parallelism the right choice versus running independent replicas?
We ran the same model, same workload, and same benchmark tool on three cluster configurations — a single DGX Spark (TP=1), two DGX Sparks (TP=2), and four DGX Sparks (TP=4) — and evaluated the results through two lenses: raw performance scaling, and SLO-driven capacity planning (how many real users each configuration can actually serve).
Two properties make this setup unusual and, we believe, worth documenting:
- The interconnect is Ethernet, not NVLink. DGX Sparks connect to each other over ConnectX-7 (200 Gb/s RDMA). Tensor parallelism across an Ethernet fabric is normally considered impractical — this study quantifies when it works and why.
- The hardware is modest and realistic. NVIDIA’s model card benchmarks this model on GB300-class data center hardware. DGX Spark (GB10) sits at the opposite end: a compact, office-friendly machine. Results here are far closer to what an on-premises deployment team will actually see.
1.2 Test Environment
Hardware — NVIDIA DGX Spark (GB10 Grace Blackwell Superchip):
| Component | Specification |
|---|---|
| GPU | Blackwell architecture (GB10), up to ~1 PFLOP FP4 |
| Memory | 128 GB unified LPDDR5X |
| Memory bandwidth | ~273 GB/s (unified, CPU+GPU) |
| Node interconnect | NVIDIA ConnectX-7, 200 Gb/s RDMA (QSFP) |
| CPU | 20-core Arm (10x Cortex-X925 + 10x Cortex-A725) |
Key architectural fact: there is no NVLink between DGX Sparks. TP=2 and TP=4 in this study are multi-node tensor parallelism — every all-reduce crosses the ConnectX-7 network. This single fact explains most of the scaling behavior observed below.
Model: nvidia/Qwen3.6-27B-NVFP4 — the NVFP4 (4-bit) quantization of Qwen3.6-27B produced with NVIDIA TensorRT Model Optimizer. The model is a dense hybrid-attention architecture (Gated DeltaNet + Gated Attention, dense FFN — no mixture-of-experts), 262K context. Architecture details are covered in Section 1.1 of the companion paper. Only text input/output was exercised; the visual encoder was not active.
Runtime: vLLM with Ray for multi-node orchestration (ghcr.io/spark-arena/dgx-vllm-eugr-nightly:latest). Identical serve flags across configurations, only -tp differs:
vllm serve nvidia/Qwen3.6-27B-NVFP4 \
    --gpu-memory-utilization 0.8 \
    --enable-prefix-caching \
    --enable-chunked-prefill \
    --quantization modelopt \
    --reasoning-parser qwen3 \
    --enable-auto-tool-choice \
    --tool-call-parser qwen3_coder \
    -tp {1|2|4}
1.3 Benchmark Tool and Workload
Measurements were taken with CordatusAI/llm-benchmark, which drives the OpenAI-compatible /v1/chat/completions endpoint with streaming and include_usage for exact token accounting, supports reasoning_content, and performs warm-up before measurement.
| Parameter | Value |
|---|---|
| Prompt pool | 100 prompts, shuffled per run |
| Input length | ~128 tokens |
| Max output tokens | 128 |
| Rounds per concurrency level | 10 (→ 10 × concurrency requests) |
| Concurrency levels | 1, 2, 4, 8, 16, 32, 64 |
| Request timeout | 50 s |
Workload character: short input, short output — a balanced prefill/decode profile typical of interactive chat turns. Long-context behavior is out of scope (see Section 8).
1.4 SLO Framework
Raw tokens-per-second numbers do not answer the question a deployment team actually has: how many users can this configuration serve well? We therefore evaluate every configuration against two service level objectives, applied simultaneously:
| SLO | Threshold | Rationale |
|---|---|---|
| TTFT (time to first token) | ≤ 1000 ms | Nielsen/NNGroup: responses within ~1 s keep the user’s flow of thought uninterrupted |
| TPS (per-request decode speed) | ≥ 15 tokens/s | Above the visual reading-speed ceiling (~700 wpm; Rayner et al., 2016) |
The largest concurrency level that satisfies both SLOs is the configuration’s C_max. Concurrent requests are then converted to supported users with Little’s Law, using a think time (the gap between a user receiving a response and sending the next request):
N_users = C_max × (1 + T_think / L_mean)
where L_mean is the mean end-to-end request latency at C_max. We use T_think = 45 s as the primary assumption (standard interactive-chat capacity planning) and report a sensitivity analysis over 15/30/60 s in Section 5.3.
1.5 Cross-Reference: Companion Benchmark and Runtime Differences
This paper is a follow-up to the Qwen3.6-27B DGX Spark Benchmark, which evaluated the same nvidia/Qwen3.6-27B-NVFP4 model on a single DGX Spark across FP8, AWQ, and NVFP4 quantization variants. The TP1 (single-node) measurements in this report and the NVFP4 baseline in the companion paper target the same hardware, the same workload shape (~128-token input, 128-token output), and the same benchmark tool — but they were captured under different vLLM runtimes and serve flags. The differences are documented here for transparency; the two papers answer complementary questions (the benchmark paper: which quantization format; this paper: how many nodes).
Runtime and serve-flag differences:
| Parameter | Companion Benchmark (NVFP4 variant) | This Paper (TP1) |
|---|---|---|
| vLLM image | vllm/vllm-openai:v0.22.0-ubuntu2404 (stock upstream) |
ghcr.io/spark-arena/dgx-vllm-eugr-nightly:latest (nightly) |
--quantization |
not specified (default NVFP4 path) | modelopt |
--enable-auto-tool-choice |
not set | enabled |
--tool-call-parser |
qwen3_coder |
qwen3_coder |
--reasoning-parser |
qwen3 |
qwen3 |
--max-num-batched-tokens |
8192 | not specified (vLLM default) |
--gpu-memory-utilization |
0.8 | 0.8 |
--enable-prefix-caching / --enable-chunked-prefill |
enabled | enabled |
| Multi-node orchestration | none (single node) | Ray (-tp {1\|2\|4}) |
The companion benchmark paper (Sections 6.4.4 and Appendix A.3) documents several SM121-specific software deficiencies in stock vLLM v0.22.0 — including a CMake
sm_121asuffix stripping bug, a missing E2M1 software conversion fallback, and unoptimized CUTLASS tile sizes — and predicts the speedup achievable when those fixes are applied. The nightly image used in this report may or may not include any subset of those fixes; no claim is made about its contents.
Single-user (C=1) result comparison:
| Metric | Companion Benchmark — NVFP4 | This Paper — TP1 | Δ |
|---|---|---|---|
| TPS (tok/s) | 9.86 | 12.63 | +28.1% |
| ITL (ms) | 100.40 | 77.97 | −22.4% |
| TTFT (ms) | 228.42 | 233.30 | +2.1% |
| Latency (s) | 12.98 | 10.14 | −21.9% |
The decode-side metrics (TPS, ITL, end-to-end latency) differ substantially; the prefill-side metric (TTFT) agrees to within ~5 ms. These differences are noted for transparency; TP1 in this report is not a re-measurement of the benchmark paper’s NVFP4 variant under identical software, and the SLO/capacity conclusions of Section 5 are derived from the TP1 column of this report, not the companion paper’s NVFP4 baseline.
2. Results
2.1 Single-User Performance (Concurrency = 1)
| Metric | TP1 | TP2 | TP4 | TP1→TP4 |
|---|---|---|---|---|
| TPS (tokens/s) | 12.63 | 22.57 | 33.11 | 2.62x |
| ITL (ms) | 77.97 | 43.48 | 29.14 | 2.67x lower |
| TTFT (ms) | 233.30 | 148.87 | 163.59 | TP2 best |
| Latency (s) | 10.14 | 5.67 | 3.87 | 2.62x lower |
Two headline observations:
- Scaling out works. A single user sees 12.6 tok/s on one Spark and 33.1 tok/s on four — the model genuinely gets 2.6x faster even though the parallelism runs over Ethernet.
- TTFT does not follow. TP4’s time-to-first-token is worse than TP2’s at low load (164 ms vs 149 ms). Prefill is compute-bound, and at batch 1 the extra all-reduce hops cost more than the parallel compute saves. Section 4.4 analyzes this.
2.2 Full Concurrency Sweep
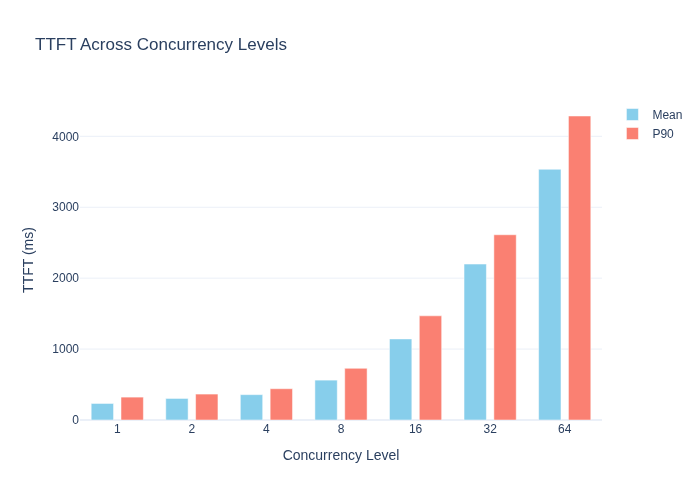
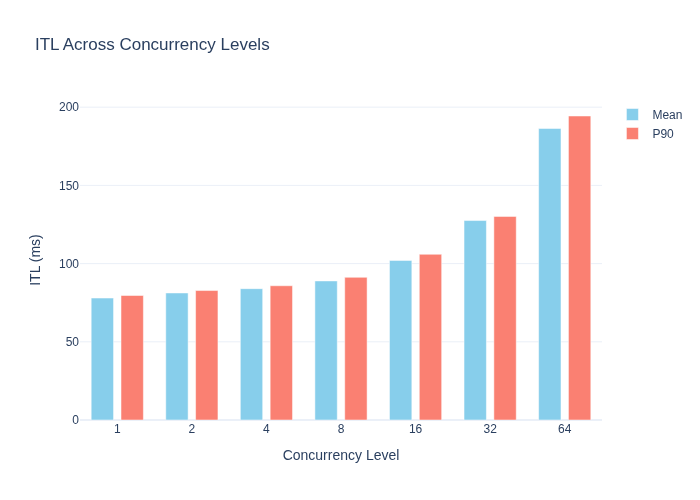
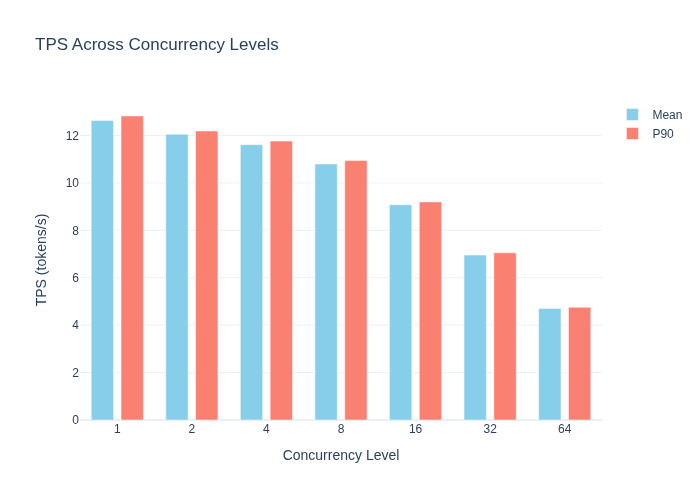
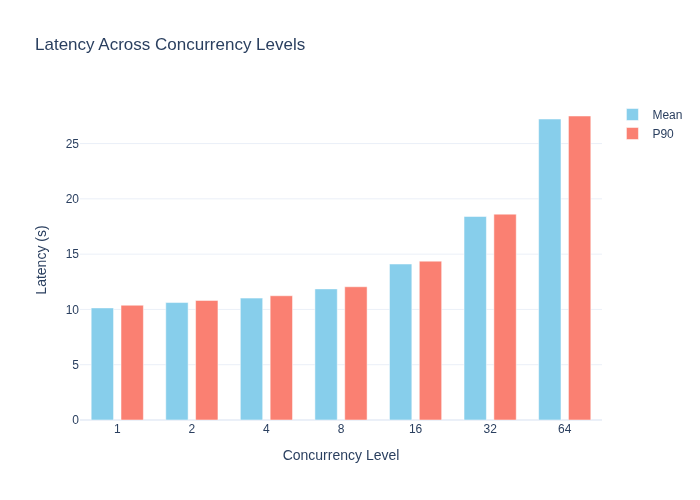
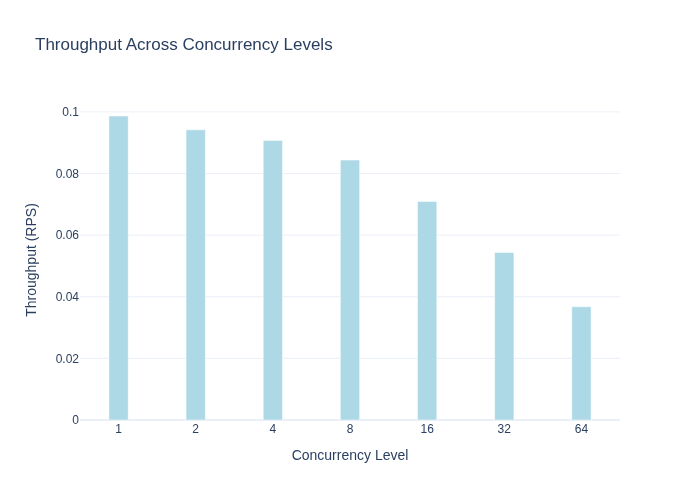
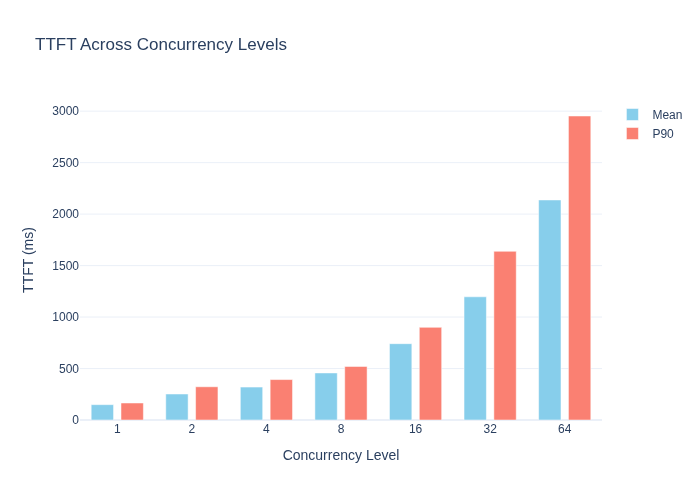
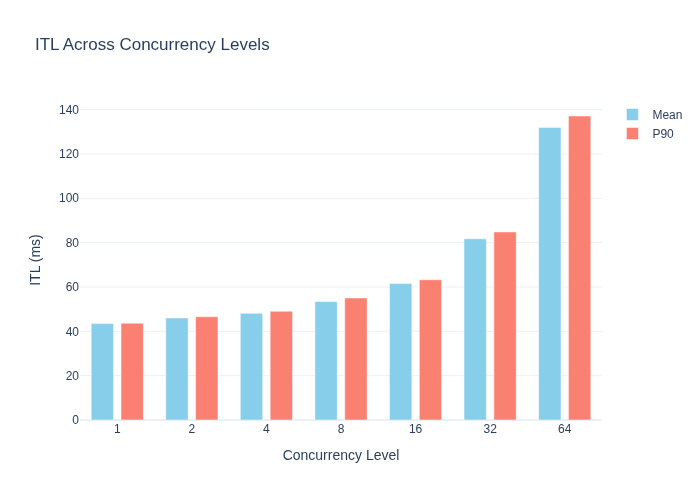
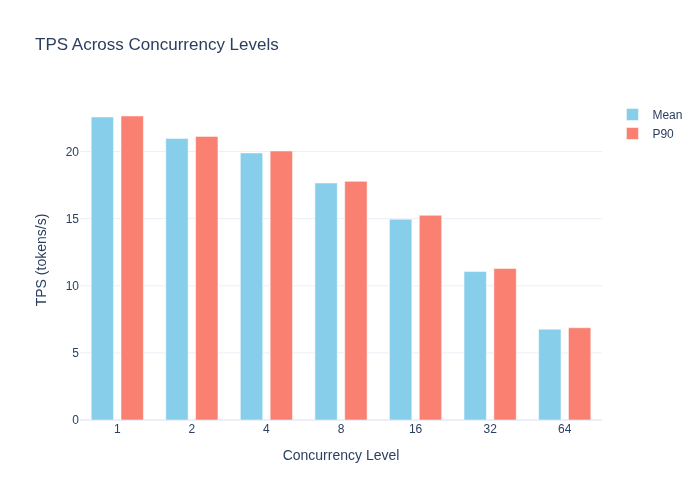
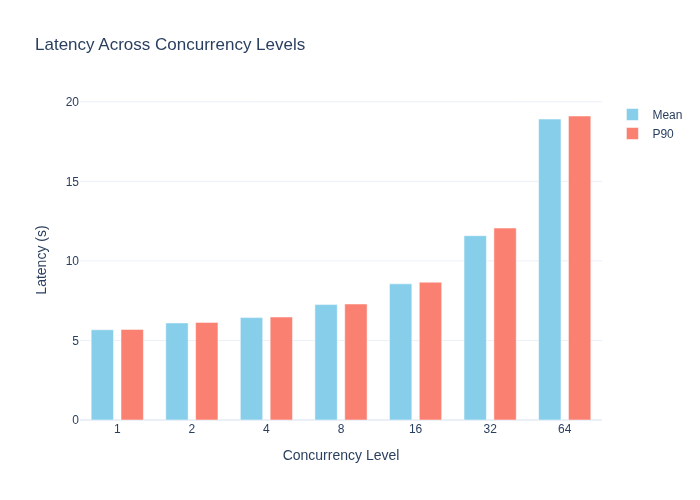
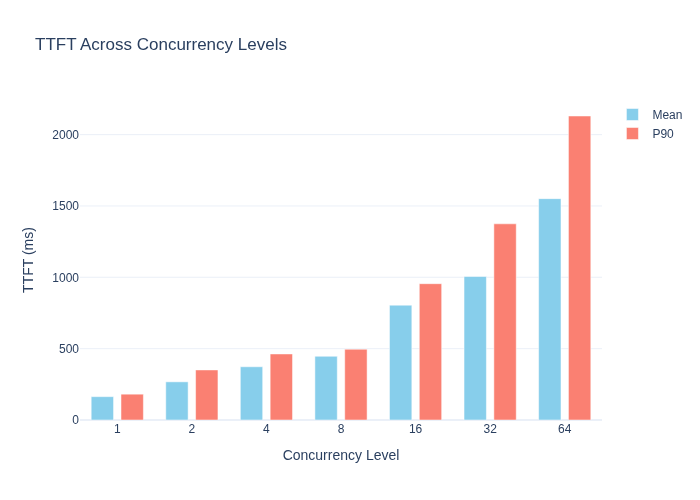
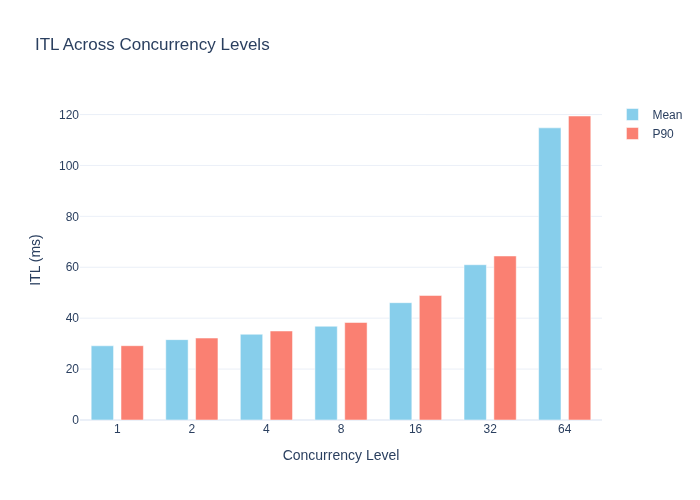
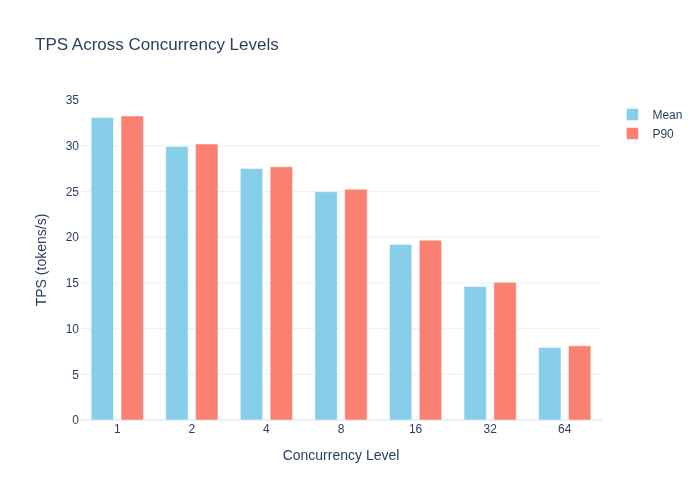
Mean values per configuration (p50 tracks the mean closely at every point; per-configuration charts including p50/p90 are in Appendix A).
TP1 — single DGX Spark:
| Concurrency | TTFT (ms) | ITL (ms) | TPS (tok/s) | Latency (s) |
|---|---|---|---|---|
| 1 | 233.30 | 77.97 | 12.63 | 10.14 |
| 2 | 304.00 | 81.22 | 12.05 | 10.62 |
| 4 | 357.46 | 83.97 | 11.61 | 11.02 |
| 8 | 562.38 | 88.92 | 10.80 | 11.86 |
| 16 | 1143.17 | 102.03 | 9.08 | 14.10 |
| 32 | 2198.77 | 127.52 | 6.96 | 18.40 |
| 64 | 3535.15 | 186.40 | 4.70 | 27.22 |
TP2 — 2x DGX Spark:
| Concurrency | TTFT (ms) | ITL (ms) | TPS (tok/s) | Latency (s) |
|---|---|---|---|---|
| 1 | 148.87 | 43.48 | 22.57 | 5.67 |
| 2 | 252.45 | 46.05 | 20.98 | 6.10 |
| 4 | 320.11 | 48.14 | 19.89 | 6.44 |
| 8 | 457.03 | 53.48 | 17.65 | 7.25 |
| 16 | 741.35 | 61.52 | 14.96 | 8.56 |
| 32 | 1196.59 | 81.72 | 11.05 | 11.59 |
| 64 | 2137.37 | 131.97 | 6.77 | 18.92 |
TP4 — 4x DGX Spark:
| Concurrency | TTFT (ms) | ITL (ms) | TPS (tok/s) | Latency (s) |
|---|---|---|---|---|
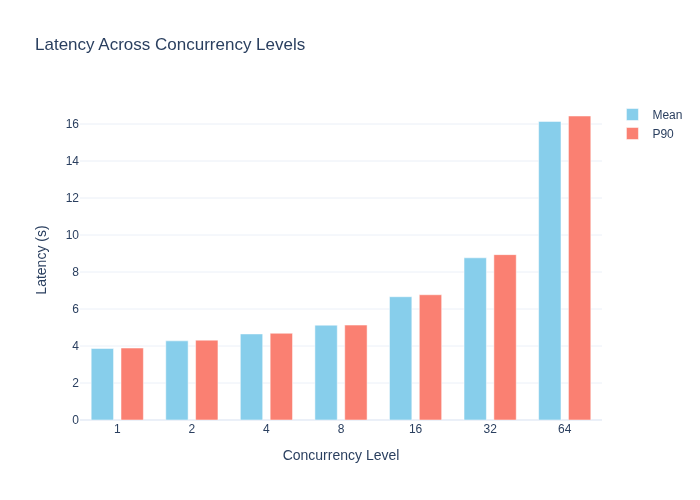
| 1 | 163.59 | 29.14 | 33.11 | 3.87 |
| 2 | 267.42 | 31.57 | 29.93 | 4.28 |
| 4 | 373.16 | 33.69 | 27.51 | 4.65 |
| 8 | 446.41 | 36.83 | 24.98 | 5.13 |
| 16 | 804.86 | 46.09 | 19.21 | 6.66 |
| 32 | 1005.44 | 60.99 | 14.61 | 8.77 |
| 64 | 1551.45 | 114.76 | 7.93 | 16.14 |
2.3 Comparison Charts
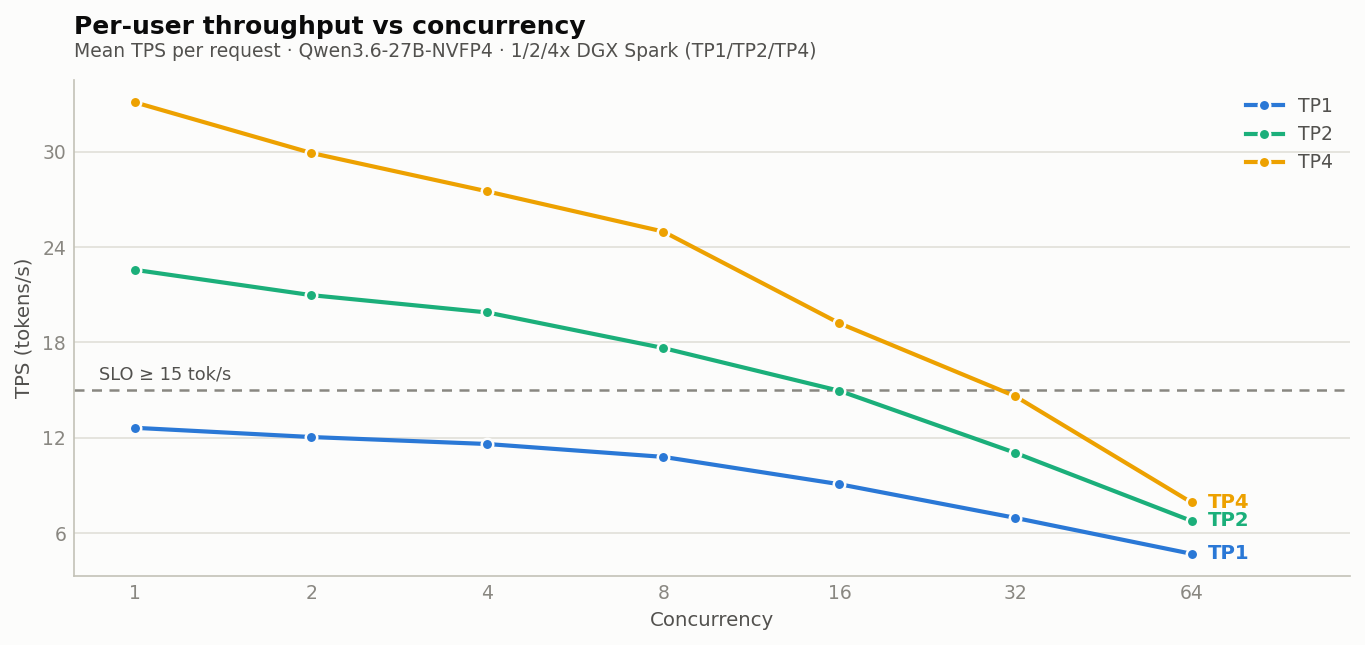 Figure 1: Per-request decode speed. The dashed line is the 15 tok/s reading-speed SLO — TP1 never crosses it, TP2 holds it to C=8, TP4 to C=16 (C=16 for TP2 lands at 14.96, a hair below; see Section 5.4).
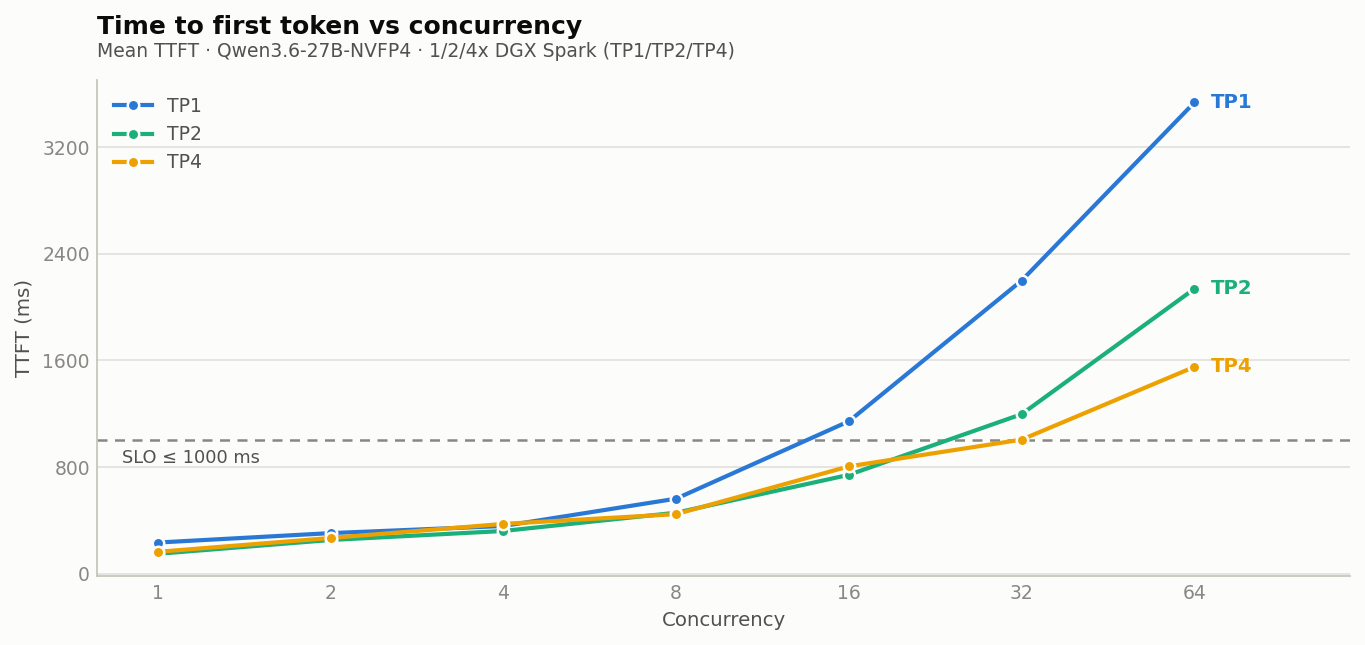 Figure 2: Time to first token. TP1 already exceeds the 1000 ms SLO at C=16 (1143 ms); TP2 and TP4 cross it at C=32 (1196 ms and 1005 ms respectively). No single instance serves C=64 interactively — replication is required.
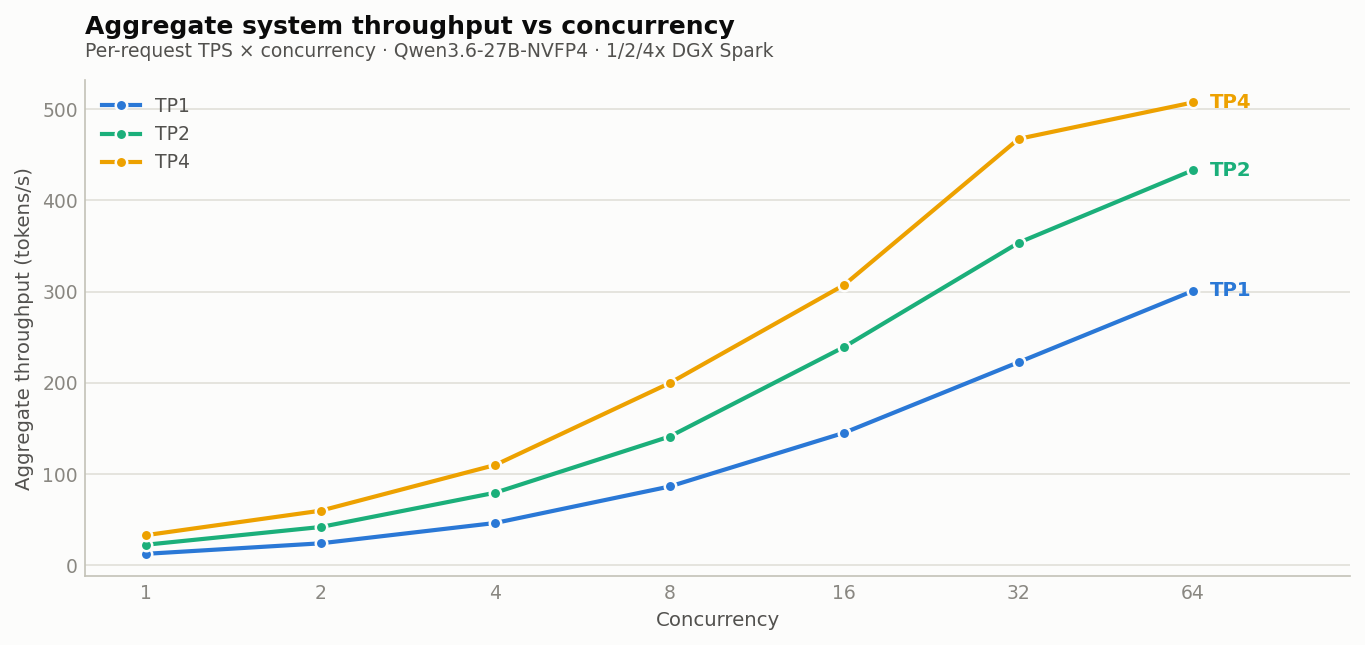 Figure 3: Aggregate system throughput (per-request TPS × concurrency). While per-user speed falls with load, total token production rises — the same cluster is a 33 tok/s assistant at C=1 and a ~508 tok/s token factory at C=64.
3. Scaling Efficiency Analysis
3.1 Diminishing Returns
TPS scaling factors against the ideal linear case:
| Step | C=1 measured | C=1 efficiency | C=64 measured | C=64 efficiency |
|---|---|---|---|---|
| TP1 → TP2 | 1.79x | 89% | 1.44x | 72% |
| TP2 → TP4 | 1.47x | 73% | 1.17x | 59% |
| TP1 → TP4 (total) | 2.62x | 66% | 1.69x | 42% |
Efficiency degrades along two independent axes:
- More nodes → more communication. Each transformer layer requires an all-reduce across all participating nodes. Going from 2 to 4 nodes increases both the data volume and the synchronization cost of every one of these operations.
- More load → a saturating network. At high concurrency the ConnectX-7 fabric carries all-reduce traffic for large batches; the communication share of each step grows, which is why C=64 efficiency (42%) is far worse than C=1 efficiency (66%).
Practical implication: on this topology, TP=4 is close to the useful limit. With the TP2→TP4 marginal gain already down to 1.17x under load, a hypothetical TP=8 would likely yield little to nothing — additional Sparks beyond four are better spent on replicas (Section 6).
3.2 Where the Loss Goes
The deviation from linear is almost entirely the network all-reduce. On an NVLink-connected system this operation costs tens of microseconds; over 200GbE RDMA it costs an order of magnitude more, and it is paid once per layer, per generated token. Section 4 explains why the arithmetic still comes out in favor of scaling out on this specific hardware.
4. Technical Deep-Dive: Why Ethernet Tensor Parallelism Works on GB10
4.1 Decode Is Memory-Bandwidth-Bound
Qwen3.6-27B is a dense model: generating each token requires reading all model weights from memory. On GB10 that memory is unified LPDDR5X at ~273 GB/s — roughly 1/30th of the HBM bandwidth of a data center GPU. Weight-read time, not arithmetic, dominates each decode step.
Tensor parallelism shards the weight matrices across nodes. With TP=4:
Spark0: W₀·x →  │
Spark1: W₁·x →  ├─ all-reduce (ConnectX-7) ─→ next token
Spark2: W₂·x →  │
Spark3: W₃·x →  │
- Each node performs 1/4 of the matrix multiplication
- Each node reads only 1/4 of the weights from its own LPDDR5X ← the actual win
- One all-reduce per layer over the 200GbE fabric ← the cost
The ITL (inter-token latency) numbers show the balance of this trade:
| Config | ITL (ms) | Speedup vs TP1 | Ideal |
|---|---|---|---|
| TP1 | 77.97 | 1.00x | 1.0x |
| TP2 | 43.48 | 1.79x | 2.0x |
| TP4 | 29.14 | 2.67x | 4.0x |
The gap to ideal is the per-layer network all-reduce; everything else scales.
4.2 TPS Is Just the Mirror of ITL
Sanity check — decode speed is the reciprocal of inter-token latency:
| Config | 1000 / ITL | Measured TPS |
|---|---|---|
| TP1 | 12.8 | 12.63 ✓ |
| TP2 | 23.0 | 22.57 ✓ |
| TP4 | 34.3 | 33.11 ✓ |
There is no independent throughput mechanism: the entire TPS gain is the ITL reduction, i.e. the bandwidth-pooling effect.
4.3 Why This Works Here and Not on Data Center GPUs
The rule of thumb “never run TP over Ethernet” comes from the HBM world, and the arithmetic explains it: the benefit of TP is proportional to weight-read time saved, and the cost is the network all-reduce. On an SM100-class data center GPU (B200/GB200, ~8 TB/s HBM3e — roughly 30x the GB10’s bandwidth), weight reads are ~30x faster, so for a 27B model the all-reduce would cost more than it saves — you would simply run the model on one GPU. (On older H100 at ~3.35 TB/s the factor is ~12x; the inequality still holds.)
On GB10 the weight-read term is enormous (low bandwidth) while the all-reduce term is moderate (200 Gb/s RDMA, small activations at short sequence lengths). The inequality flips. Ethernet tensor parallelism is profitable on DGX Spark precisely because the memory bandwidth is the bottleneck — the platform’s weakness is what makes scale-out effective.
Two additional properties of this model help:
- It is dense. Every forward pass touches every weight, so every node does full work on every token. An MoE model would leave nodes idle whenever their experts weren’t routed to, degrading TP efficiency.
- NVFP4 halves the traffic-to-compute ratio. 4-bit weights mean each node reads fewer bytes per token, keeping the compute phase short relative to the (fixed-size) activation exchange.
4.4 The Prefill Exception
Prefill (prompt processing) is compute-bound, not bandwidth-bound — all 128 input tokens are processed in parallel and arithmetic dominates. TP helps compute too, but far less, and at batch 1 the all-reduce overhead exceeds the parallelization gain: TP4’s C=1 TTFT (164 ms) is worse than TP2’s (149 ms). Only under heavy load, when prefill batches are large, does TP4 pull ahead (C=64: 1551 ms vs 2137 ms). If your workload is TTFT-critical and lightly loaded, more TP is not automatically better.
5. SLO-Driven Capacity Planning
5.1 C_max: The Highest SLO-Compliant Concurrency
Applying both SLOs (TTFT ≤ 1000 ms and TPS ≥ 15 tok/s) to the tables in Section 2.2:
| Config | C_max | Binding constraint | Latency @ C_max |
|---|---|---|---|
| TP1 | 0 | TPS = 12.63 < 15 even at C=1 | — |
| TP2 | 8 | C=8 passes both SLOs (TPS 17.65, TTFT 457 ms); C=16 fails TPS (14.96 < 15) | 7.25 s |
| TP4 | 16 | C=16 passes both (TPS 19.21, TTFT 805 ms); C=32 fails both (TTFT 1005 ms, TPS 14.61) | 6.66 s |
Critical finding: under this SLO framework, a single DGX Spark cannot serve this model in production at all — its decode speed is below reading speed even for one user. Two Sparks are the minimum viable production unit.
5.2 Supported Users (Little’s Law, T_think = 45 s)
| Config | C_max | N_users |
|---|---|---|
| TP1 | 0 | 0 |
| TP2 | 8 | ~58 |
| TP4 | 16 | ~124 |
TP4 supports 2.14x the users of TP2 — substantially better than its raw TPS scaling over TP2 (1.47x), because two effects compound: C_max doubles and latency at C_max is lower, so each slot recycles faster. Note also that per-Spark efficiency is preserved under the SLO lens: TP2 serves ~29 users per machine, TP4 ~31 — adding machines does not dilute per-device value, unlike the raw-throughput picture.
5.3 Sensitivity: Think Time
Think time depends on the use case; 45 s fits reflective chat. Recomputing N_users:
| Scenario | T_think | TP2 | TP4 |
|---|---|---|---|
| Agentic / rapid-fire | 15 s | ~25 | ~52 |
| Active chat | 30 s | ~41 | ~88 |
| Reflective chat (primary) | 45 s | ~58 | ~124 |
| Reading-heavy / occasional | 60 s | ~74 | ~160 |
The TP4/TP2 ratio stays ~2.1x across the board — the think-time assumption shifts absolute capacity, not the comparison.
5.4 Sensitivity: SLO Thresholds — a Knife-Edge Result
Two of the measured points sit almost exactly on the SLO thresholds, and the capacity conclusions are sensitive to them:
- TP2 at C=16 delivers TPS = 14.96 — 0.3% below the 15 tok/s threshold. If the SLO were 14.9 tok/s, TP2’s C_max would jump to 16 and its capacity to ~100 users — nearly matching TP4’s 124 with half the hardware.
- TP4 at C=32 misses both thresholds by whiskers (TTFT 1005 ms, TPS 14.61). A slightly relaxed SLO (1100 ms / 14.5 tok/s) would double TP4’s C_max to 32 and its capacity to ~197 users.
- A stricter TTFT SLO (≤ 500 ms, e.g. RAG or agent pipelines) caps TP4 at C_max = 8 (TTFT 805 ms at C=16) → ~78 users, shrinking its advantage over TP2 to 1.35x.
- A relaxed TPS SLO (≥ 10 tok/s, casual use) finally brings TP1 into play: C_max = 8, ~38 users on a single Spark.
Recommendation: treat the SLO thresholds as first-class deployment parameters, not fixed constants. On this hardware the capacity answer can change by ~2x within the plausible range of thresholds — validate C_max against your SLO before sizing a cluster.
6. Deployment Topologies: Tensor Parallelism vs Replication
Owning four DGX Sparks does not mean running TP=4. The same fleet supports three topologies, and our data answers all three (2x TP2 and 4x TP1 are derived by multiplying single-instance results; a load balancer in front is assumed):
| Topology | SLO users (45 s think) | Aggregate max throughput | High availability |
|---|---|---|---|
| 4x TP1 (replicas) | 0 | ~1203 tok/s | best |
| 2x TP2 (replica pair) | ~116 | ~867 tok/s | one pair survives |
| 1x TP4 | ~124 | ~508 tok/s | none — single point of failure |
The pattern generalizes into a simple decision rule:
Latency and SLO compliance → tensor parallelism. Raw throughput → replicas.
TP pools memory bandwidth to make each request faster; replication multiplies slots without making any request faster. Since the TPS SLO is a per-request speed floor, only TP can lift a configuration over it — no number of TP1 replicas ever will. Conversely, for offline workloads with no per-request SLO (batch summarization, synthetic data generation, evaluation runs), replicas deliver 2.4x the total tokens of TP4 from the same four machines.
Recommendation matrix:
| Deployment goal | Configuration |
|---|---|
| Development, prototyping, single power user | 1x DGX Spark (TP1) |
| Interactive service, small team (~50 users) | 2x DGX Spark, TP2 |
| Interactive service, ~100+ users, HA required | 4x DGX Spark as 2x TP2 + load balancer |
| Interactive service, max capacity per fleet, HA acceptable risk | 4x DGX Spark as 1x TP4 |
| Offline / batch token production | N x TP1 replicas |
Note how close 2x TP2 (~116 users) and 1x TP4 (~124 users) are: the ~7% capacity premium of TP4 buys a single point of failure, while 2x TP2 keeps serving (at half capacity) through a node-pair failure — and wins outright under the relaxed-SLO scenario of Section 5.4. For most production deployments 2x TP2 is the more robust choice; TP4 is for maximizing single-tenant capacity or single-user speed (33 tok/s).
7. Accuracy: NVFP4 vs FP8
Scaling conclusions only matter if the 4-bit model is worth serving. NVIDIA’s model card reports near-parity between FP8 and NVFP4 across text and multimodal benchmarks:
| Benchmark | FP8 | NVFP4 | Δ |
|---|---|---|---|
| MMLU Pro | 86.1 | 86.3 | +0.2 |
| GPQA Diamond | 86.0 | 85.5 | −0.5 |
| HLE | 21.7 | 21.8 | +0.1 |
| τ²-Bench Telecom | 95.2 | 95.4 | +0.2 |
| MMMU Pro | 74.6 | 74.3 | −0.3 |
| SciCode | 44.8 | 44.5 | −0.3 |
| AIME 2025 | 93.1 | 92.7 | −0.4 |
| AA-LCR | 68.8 | 68.3 | −0.5 |
| IFBench | 65.1 | 65.5 | +0.4 |
Accuracy cost is under 1 point on every benchmark, against a ~4x memory footprint reduction versus 16-bit — and, per Section 4.3, the smaller weights are themselves part of why multi-node TP is efficient on this platform. For a hardware-level analysis of NVFP4 execution on GB10 (including SM121 limitations), see the companion paper.
8. Limitations and Future Work
- Single workload shape. All results are for ~128-token inputs and 128-token outputs. Long-context workloads (RAG over the 262K window) shift work toward compute-bound prefill, where TP gains are weakest — the TP4 advantage would likely shrink for TTFT-heavy, long-prompt traffic. Long-output (reasoning) workloads shift the other way. Both merit dedicated sweeps.
- Derived replica numbers. The 2x TP2 and 4x TP1 topology figures in Section 6 are computed from single-instance measurements; a measured load-balanced deployment would add queueing and routing effects.
- Text only. The model’s image/video capability was not exercised.
- Hardware specificity. These results characterize the GB10 class (low-bandwidth unified memory + 200GbE fabric). They do not transfer to HBM/NVLink systems, where the Section 4.3 arithmetic inverts — nor, therefore, do NVIDIA’s GB300 model-card figures predict DGX Spark behavior.
- Future work: pipeline parallelism as an alternative to TP on this fabric (fewer, larger transfers), measured replica deployments, long-context sweeps, and MTP × TP interaction.
9. Conclusion
- A single DGX Spark runs Qwen3.6-27B, but as a workstation, not a server. 12.6 tok/s is fine for one developer and below the interactive SLO for a user base. Two Sparks are the minimum production unit.
- Tensor parallelism over 200GbE genuinely works on this platform — 2.62x single-user speedup on four nodes — because GB10’s low memory bandwidth, the model’s dense architecture, and NVFP4’s small weights all tilt the compute-vs-communication balance in TP’s favor. This does not generalize to HBM-class hardware.
- TP=4 is the practical scaling limit on this fabric. Marginal efficiency falls to 1.17x under load; spend the fifth Spark on a replica.
- Under SLOs, TP4 serves ~124 users, TP2 ~58, TP1 zero (45 s think time) — and per-Spark capacity holds steady at ~30 users/machine, so scaling out does not waste hardware.
- The same four Sparks are three different products: ~124-user interactive service (TP4), ~116-user HA service (2x TP2), or a ~1200 tok/s batch engine (4x TP1). Choose the topology from the goal — TP for per-request speed, replicas for total throughput — and treat SLO thresholds as tunable inputs, because the capacity answer moves by ~2x within their plausible range.
Appendix A: Per-Configuration Charts
A.1 TP1 — Single DGX Spark
A.2 TP2 — 2x DGX Spark
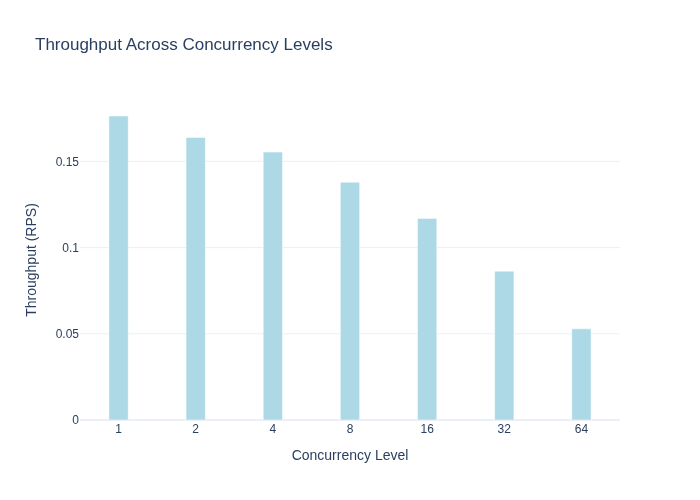
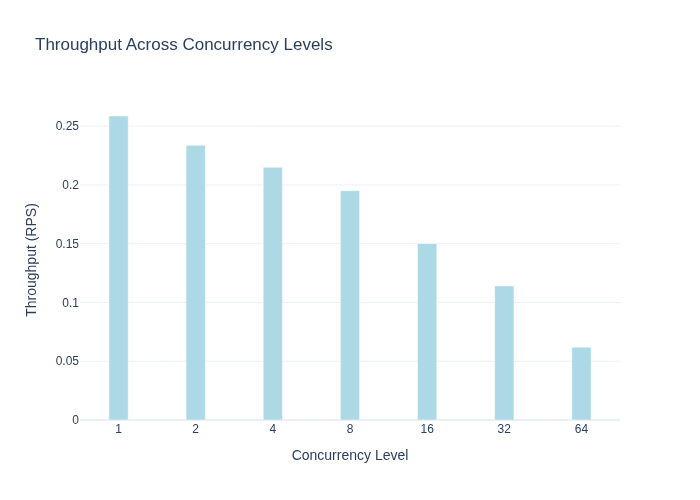
A.3 TP4 — 4x DGX Spark
Openzeka Teknoloji A.Ş. — openzeka.com · Tel: +90 312 266 2055
Üniversiteler Mah. Şehit Mustafa Tayyarcan Cad. Tepe Binası No:5 İç Kapı No:315, 06800 Çankaya/Ankara