Prepared by: Openzeka Teknoloji A.Ş. — Official Embedded Compute Distributor for NVIDIA Türkiye & MEA, and NVIDIA Elite Partner
Test platform: NVIDIA DGX Spark (GB10) · Model: Qwen3.6-27B · Report date: July 2026
Contents
- 1. Introduction and Test Methodology
- 2. Performance of Quantization Variants
- 3. Quantization Format Comparison
- 4. In-Depth Analysis of the MTP Effect
- 5. Analysis of the Concurrency Effect
- 6. Scalability and GPU Efficiency Analysis
- 7. Tail Latency and Stability
- 8. Optimal Operating Point and Recommendations
- 9. Conclusion
- Appendix A: Quantitative Impact of SM121 Hardware Deficiencies
- Appendix B: Variant-Based Charts
- About Us — Openzeka
1. Introduction and Test Methodology
1.1 Model Introduction
Qwen3.6-27B is a 27-billion-parameter large language model from Alibaba’s Qwen family. Developed after the Qwen3.5 series with community feedback, this version offers significant improvements particularly in agentic coding (front-end workflows and repository-level reasoning) and thinking preservation (preserving reasoning context from past messages).
This report evaluates the performance of the same model with different quantization formats and MTP (Multi-Token Prediction) configurations on the NVIDIA DGX Spark platform.
Model Architecture:
| Parameter | Value |
|---|---|
| Parameter count | 27B |
| Hidden Dimension | 5120 |
| Layer count | 64 |
| Architecture layout | 16 × (3 × Gated DeltaNet → FFN → 1 × Gated Attention → FFN) |
| DeltaNet attention heads | V: 48, QK: 16, Head dim: 128 |
| Gated Attention heads | Q: 24, KV: 4, Head dim: 256 |
| RoPE dimension | 64 |
| FFN intermediate size | 17408 |
| Token embedding size | 248320 (padded) |
| Context length | 262,144 tokens (native), expandable up to 1,010,000 with YaRN |
| MTP support | Supported with multi-steps training |
| Visual encoder | Present (Image-Text-to-Text) |
Note: Within the scope of this benchmark, only text input/output was used; the visual encoder is not active.
1.2 Tested Variants
| Variant | Quantization | MTP | Description |
|---|---|---|---|
| FP8 | FP8 (8-bit floating point) | None | 8-bit floating point quantization |
| FP8-MTP | FP8 | Yes | FP8 + Multi-token prediction |
| AWQ-MTP | AWQ (Activation-aware Weight Quantization) | Yes | Activation-aware weight quantization + MTP |
| NVFP4 | NVFP4 (4-bit NVIDIA format) | None | NVIDIA-specific 4-bit quantization |
| NVFP4-MTP | NVFP4 | Yes | NVFP4 + Multi-token prediction |
Note: The AWQ variant has no test without MTP. Therefore, the direct comparison of the MTP effect can only be made for FP8 and NVFP4.
1.3 Quantization Formats
- FP8 (Float8): 8-bit floating point number format. Converts model weights from BF16 to FP8. The quantization method applied by Qwen is fine-grained FP8 quantization with a block size of 128; its performance metrics are nearly identical to the original model. Precision loss is minimal. Since FP8 uses 8 bits per weight, it halves the model size and memory bandwidth requirement compared to the original BF16 model; however, it is ~2x larger than the 4-bit formats (AWQ, NVFP4) in this report and demands higher memory bandwidth — which is the main reason NVFP4 surpasses FP8 in the decode phase (memory-bound) (see Section 3.1). Source:
Qwen/Qwen3.6-27B-FP8 - AWQ (Activation-aware Weight Quantization): A method that quantizes weights to 4-bit but preserves activations. Only weights are quantized; activations remain at full precision. It saves memory bandwidth. At runtime, vLLM automatically converts AWQ weights to the Marlin kernel; this hardware-level acceleration is one of the main reasons for the performance advantage in the decode phase. Source:
shawnw3i/Qwen3.6-27B-AWQ-MTP - NVFP4 (NVIDIA Float4): 4-bit floating point format optimized by NVIDIA for the Blackwell architecture. Offers the highest compression ratio, with hardware-level acceleration support. It is calibrated on the UltraChat dataset; prepared with sequences up to 16K context length and an approximately 2M token calibration budget. The calibration being based on a chat-weighted UltraChat distribution may affect accuracy behavior in different domains (e.g., code, math); since this benchmark only measures speed, that effect is not evaluated. Source:
unsloth/Qwen3.6-27B-NVFP4
1.4 What is MTP (Multi-Token Prediction)?
MTP is a technique that enables the model to predict multiple tokens per forward pass. While traditional autoregressive models generate only one token per step, with MTP multiple tokens can be generated per step. This significantly increases the token generation rate (TPS) while reducing the inter-token latency (ITL) value.
How MTP works:
- At each decode step, the model generates N tokens
- Generated tokens are checked with a verification mechanism
- Correctly predicted tokens are added directly to the output
- Incorrect predictions are rejected and regenerated
1.5 Metric Definitions
| Metric | Unit | Description |
|---|---|---|
| TTFT (Time To First Token) | ms | The time elapsed from sending the request to the generation of the first token. Reflects the speed of the prefill phase. |
| ITL (Inter-Token Latency) | ms | The delay between two consecutive tokens. Reflects the speed of the decode phase. |
| TPS (Tokens Per Second) | tokens/s | The average number of tokens generated per second. The perceived speed on the user side. |
| Latency | s | The total time elapsed from the start of a request to its completion (end-to-end). |
| Throughput | RPS | Measurement tool’s per-request definition: valid_request_count / Σ(latency) = 1 / average_latency. This is the completion rate per second of a single request stream; it is NOT the system’s total (fleet) work capacity. |
⚠️ Important — Correct interpretation of the “Throughput (RPS)” metric: The measurement tool used (CordatusAI/llm-benchmark) computes this value in its source code as
throughput = valid_request_count / Σ(latency_i); this is algebraically equal to1 / average_latencyand is independent of concurrency by definition. In other words, the metric staying flat does not prove the GPU is not scaling — it only reflects that a single stream measures the inverse of latency. The system’s true total capacity is measured asTPS × Concurrency(total tokens/s) orConcurrency / average_latency(total RPS) and increases markedly with concurrency (see Sections 5.5 and 6.1). This distinction is critical for the concurrency interpretations of the report (Sections 5.5, 8.2, 9.1).
1.6 Test Conditions
- Platform: NVIDIA DGX Spark
- Concurrency levels: 1, 2, 4, 8, 16 concurrent requests
- Statistical measurements: Mean, p50 (median), p90 (90th percentile) values were recorded for each metric
- For each variant, 5 metrics × 5 concurrency levels = 25 data points were collected
1.7 Measurement Tool
All measurements were performed with the CordatusAI/llm-benchmark open source tool. This tool is a Streamlit-based application designed to measure the performance of LLM inference servers over the OpenAI-compatible streaming API.
Method of Operation:
- Streaming requests are sent to the OpenAI-compatible
/v1/chat/completionsendpoint - Token counts are verified server-side with
stream_options={"include_usage": True} - With
reasoning_contentsupport, reasoning tokens of reasoning models are also included in the measurement
Measurement Parameters:
| Parameter | Value | Description |
|---|---|---|
| Prompt count | 100 | Loaded from prompts.txt file, randomly ordered on each run |
| Prompt length | ~128 tokens | Each prompt explicitly requests at least 128 tokens of response |
| Maximum output tokens | 128 | Responses are cut off at 128 tokens |
| Minimum rounds | 10 | At least 10 rounds per concurrency level |
| Total request count | 10 × concurrency | Concurrency=8 → 80 requests, Concurrency=16 → 160 requests |
| Warm-up | 1 request | 1 warm-up request is sent before the benchmark |
| Statistical measurements | Mean, p50, p90 | Average, median, and 90th percentile are calculated for each metric |
Limitation: The request count at each concurrency level is 10 × concurrency; at C=1 only ~10 samples are measured. Therefore, especially p90 values at low concurrency and TTFT fluctuations (e.g., the irregular TTFT trajectory of AWQ-MTP, Section 2.3; the p90/p50=1.56 value of NVFP4-MTP, Section 7.1) may partially reflect small-sample noise. For definitive tail-latency characterization, re-measurement with higher request counts is recommended.
1.8 Inference Server Configuration
All variants were run with vLLM v0.22.0 (vllm/vllm-openai:v0.22.0-ubuntu2404 Docker image).
Common Configuration:
| Parameter | Value |
|---|---|
| Inference engine | vLLM v0.22.0 |
| Docker image | vllm/vllm-openai:v0.22.0-ubuntu2404 |
| GPU memory utilization | 0.8 (80%) |
| Maximum batched tokens | 8192 |
| Prefix caching | Enabled (--enable-prefix-caching) |
| Chunked prefill | Enabled (--enable-chunked-prefill) |
| Reasoning parser | qwen3 |
| Tool call parser | qwen3_coder |
| API port | 8000 |
Note: In NVFP4 variants, the
--max-num-batched-tokensparameter is not specified; vLLM uses the default value. In the NVFP4-MTP variant, generation parameters were customized with--override-generation-config.
2. Performance of Quantization Variants
2.1 Qwen3.6-27B-FP8
FP8 quantization stores model weights in 8-bit floating point format. This variant does not use MTP.
Performance Table:
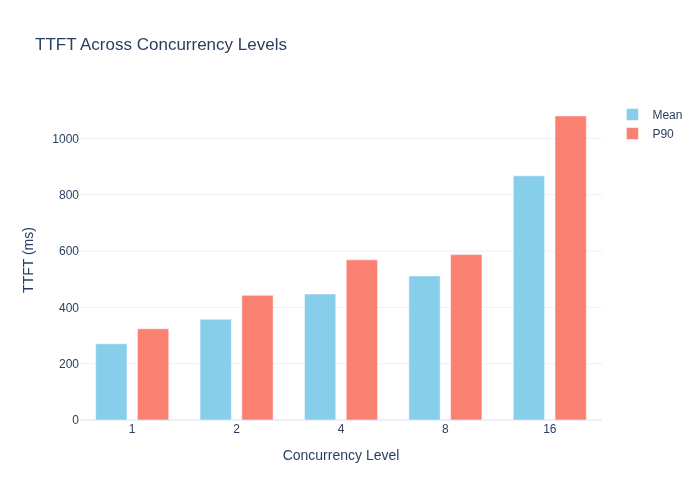
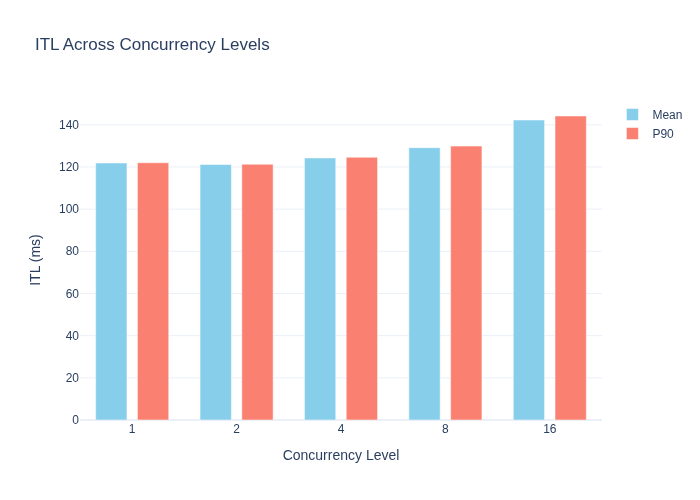
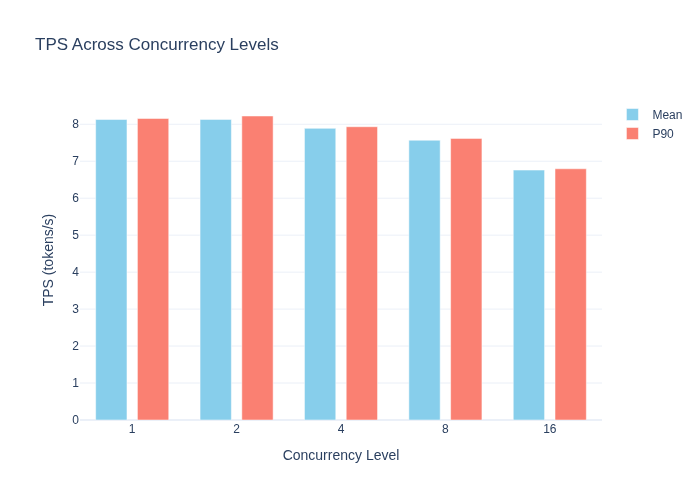
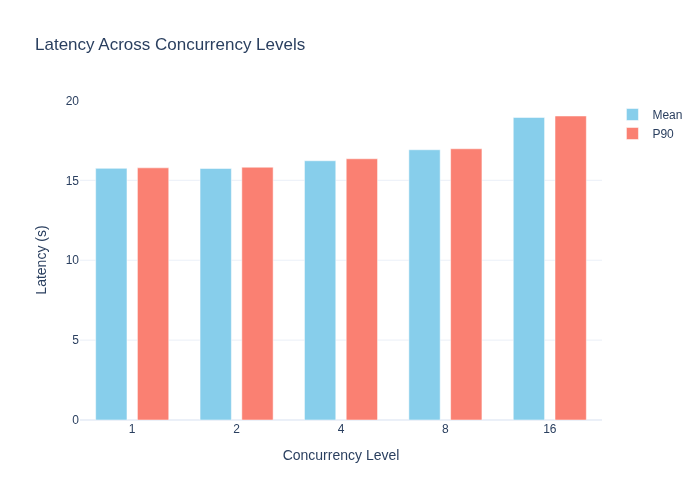
| Concurrency | TTFT (ms) | ITL (ms) | TPS (tok/s) | Latency (s) | Throughput (RPS) |
|---|---|---|---|---|---|
| 1 | 270.57 | 121.87 | 8.13 | 15.75 | 0.06 |
| 2 | 357.77 | 121.13 | 8.13 | 15.74 | 0.06 |
| 4 | 447.17 | 124.23 | 7.89 | 16.23 | 0.06 |
| 8 | 511.45 | 129.14 | 7.57 | 16.91 | 0.06 |
| 16 | 866.95 | 142.24 | 6.76 | 18.93 | 0.05 |
Evaluation:
Since the FP8 variant does not use MTP, its token generation rate is limited. The ITL value staying around ~122ms indicates that only ~8 tokens can be generated per second. As concurrency increases, ITL rises slightly (122ms → 142ms), but the TPS drop (17%) and latency increase (20%) are relatively muted. This shows that FP8 cannot fully saturate the GPU and there is idle capacity.
TTFT, on the other hand, increases markedly with concurrency (271ms → 867ms, +221%). This reveals that the prefill phase intensively uses GPU compute resources and queuing occurs under concurrent requests.
Why do ITL and TTFT behave differently? The GPU facing two different bottlenecks in the two phases explains this: The Decode phase is memory-bound — only 1 token is generated per step and the dominant operation is loading weights from GPU memory; the compute units have idle capacity. The Prefill phase is compute-bound — all input tokens are processed at once, requiring intensive matrix multiplications, and the GPU’s SM units operate at full capacity. Therefore, when concurrency increases, decode is slightly affected while serious queuing occurs in prefill (see Section 6.3 for detailed analysis).
2.2 Qwen3.6-27B-FP8-MTP
FP8 quantization + MTP combination. Thanks to MTP, multiple tokens are generated per decode step.
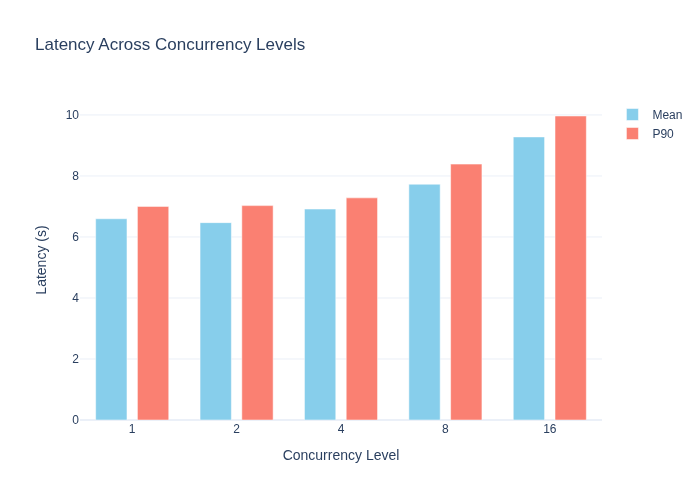
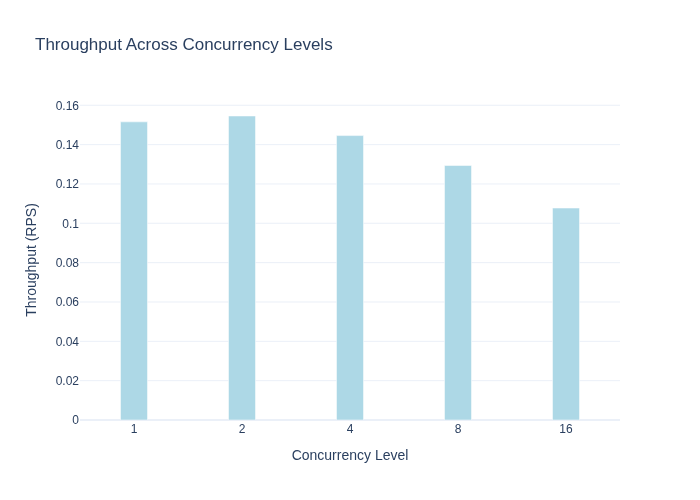
Performance Table:
| Concurrency | TTFT (ms) | ITL (ms) | TPS (tok/s) | Latency (s) | Throughput (RPS) |
|---|---|---|---|---|---|
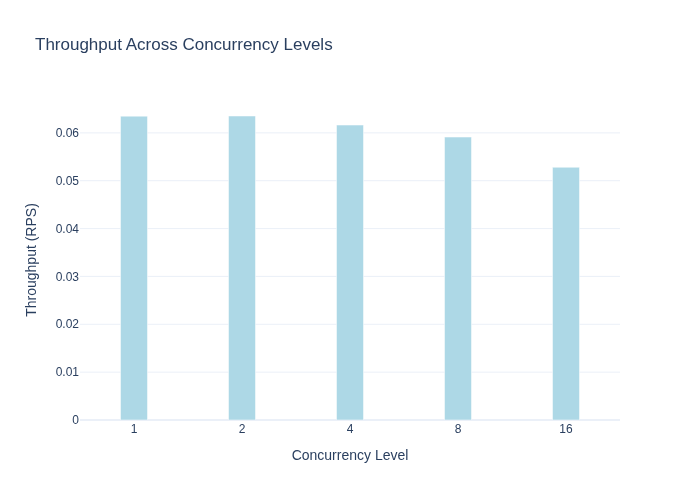
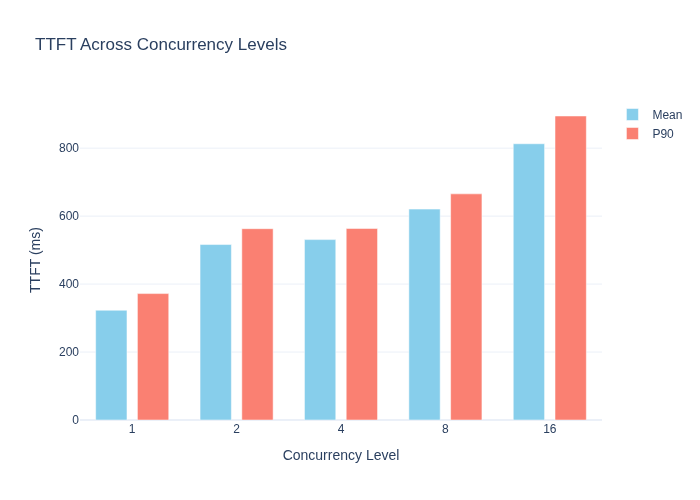
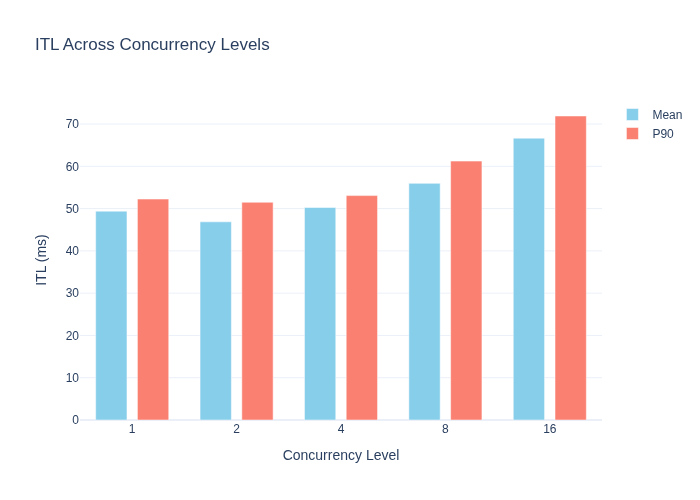
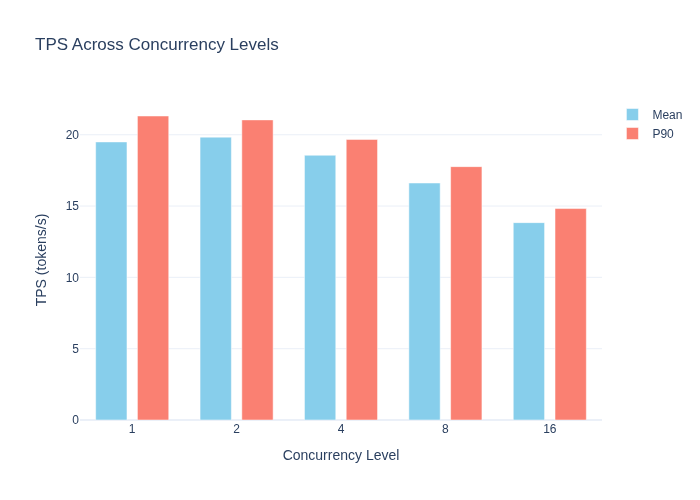
| 1 | 322.95 | 49.40 | 19.50 | 6.60 | 0.15 |
| 2 | 516.27 | 46.87 | 19.83 | 6.47 | 0.15 |
| 4 | 530.80 | 50.26 | 18.56 | 6.92 | 0.14 |
| 8 | 620.59 | 55.97 | 16.62 | 7.73 | 0.13 |
| 16 | 812.93 | 66.66 | 13.84 | 9.28 | 0.11 |
Evaluation:
The effect of MTP is striking: ITL dropped from 122ms to 49ms (~60% decrease), and TPS rose from 8.13 to 19.50 (~140% increase). Total latency dropped from 15.75s to 6.60s (~58% decrease). This confirms that MTP dramatically accelerates the decode phase.
However, sensitivity to concurrency increase is higher: TPS drops 29% (vs 17% in FP8 without MTP), latency increases 40% (vs 20% in FP8 without MTP). It appears that a fast model uses the GPU more effectively and resource contention becomes pronounced under additional load.
TTFT has a higher starting value compared to the FP8 variant without MTP (323ms vs 271ms). This suggests that MTP may bring additional computational load to the prefill phase. The marked increase of TTFT with concurrency is due to the compute-bound nature of the prefill phase (see the prefill/decode bottleneck explanation in Section 2.1).
2.3 Qwen3.6-27B-AWQ-MTP
AWQ quantization + MTP combination. AWQ compresses weights to 4-bit and saves memory bandwidth.
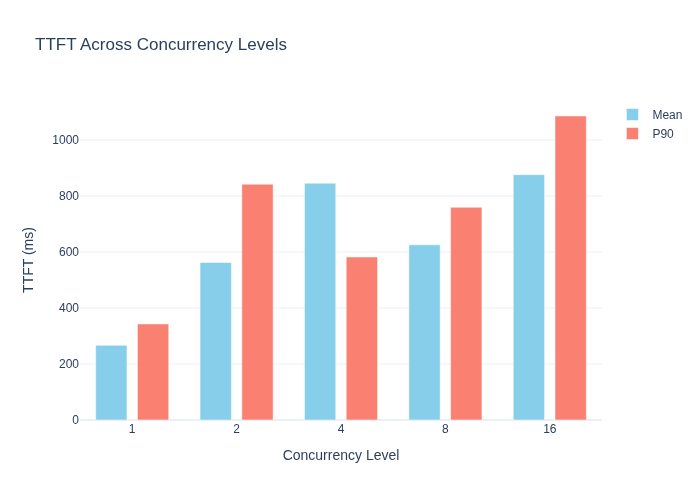
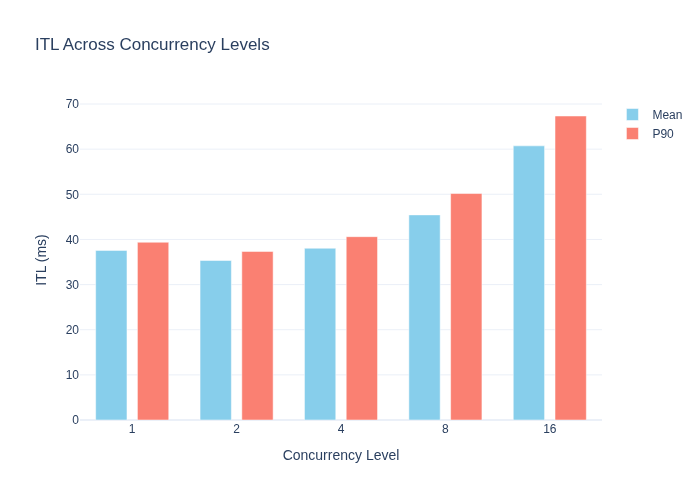
Performance Table:
| Concurrency | TTFT (ms) | ITL (ms) | TPS (tok/s) | Latency (s) | Throughput (RPS) |
|---|---|---|---|---|---|
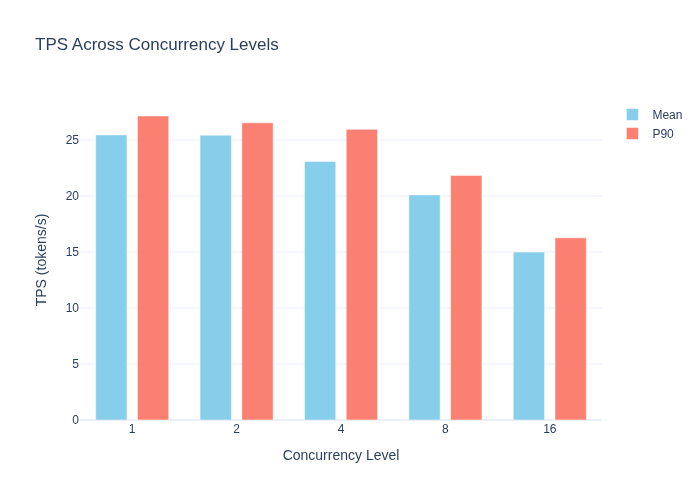
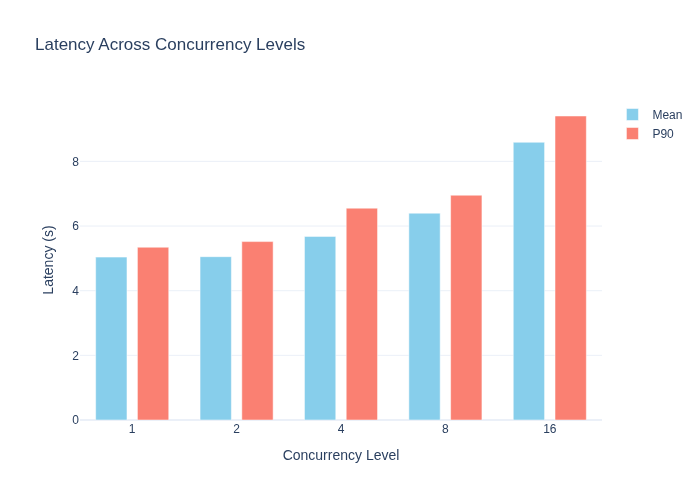
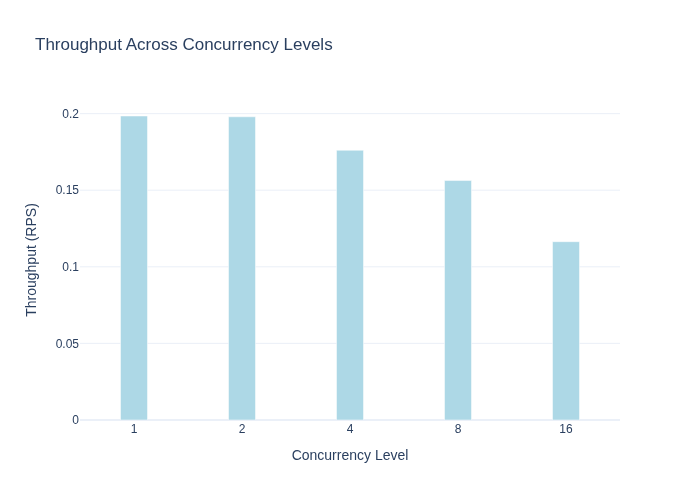
| 1 | 266.65 | 37.57 | 25.45 | 5.04 | 0.20 |
| 2 | 562.95 | 35.34 | 25.42 | 5.05 | 0.20 |
| 4 | 845.97 | 38.05 | 23.08 | 5.68 | 0.18 |
| 8 | 625.74 | 45.44 | 20.09 | 6.40 | 0.16 |
| 16 | 876.55 | 60.73 | 14.99 | 8.59 | 0.12 |
Evaluation:
AWQ-MTP offers the highest performance among all variants. At Concurrency=1, it is the clear leader with 25.45 tok/s TPS, 37.57ms ITL, and 5.04s latency values. When AWQ’s memory bandwidth savings are combined with MTP’s multi-token generation, the decode phase is dramatically accelerated.
However, this variant is the most sensitive to concurrency increase: TPS drops 41% (25.45 → 14.99), ITL increases 62% (37.57ms → 60.73ms), latency increases 70% (5.04s → 8.59s). This indicates that the GPU is highly utilized even under low load, and additional load leads to resource contention.
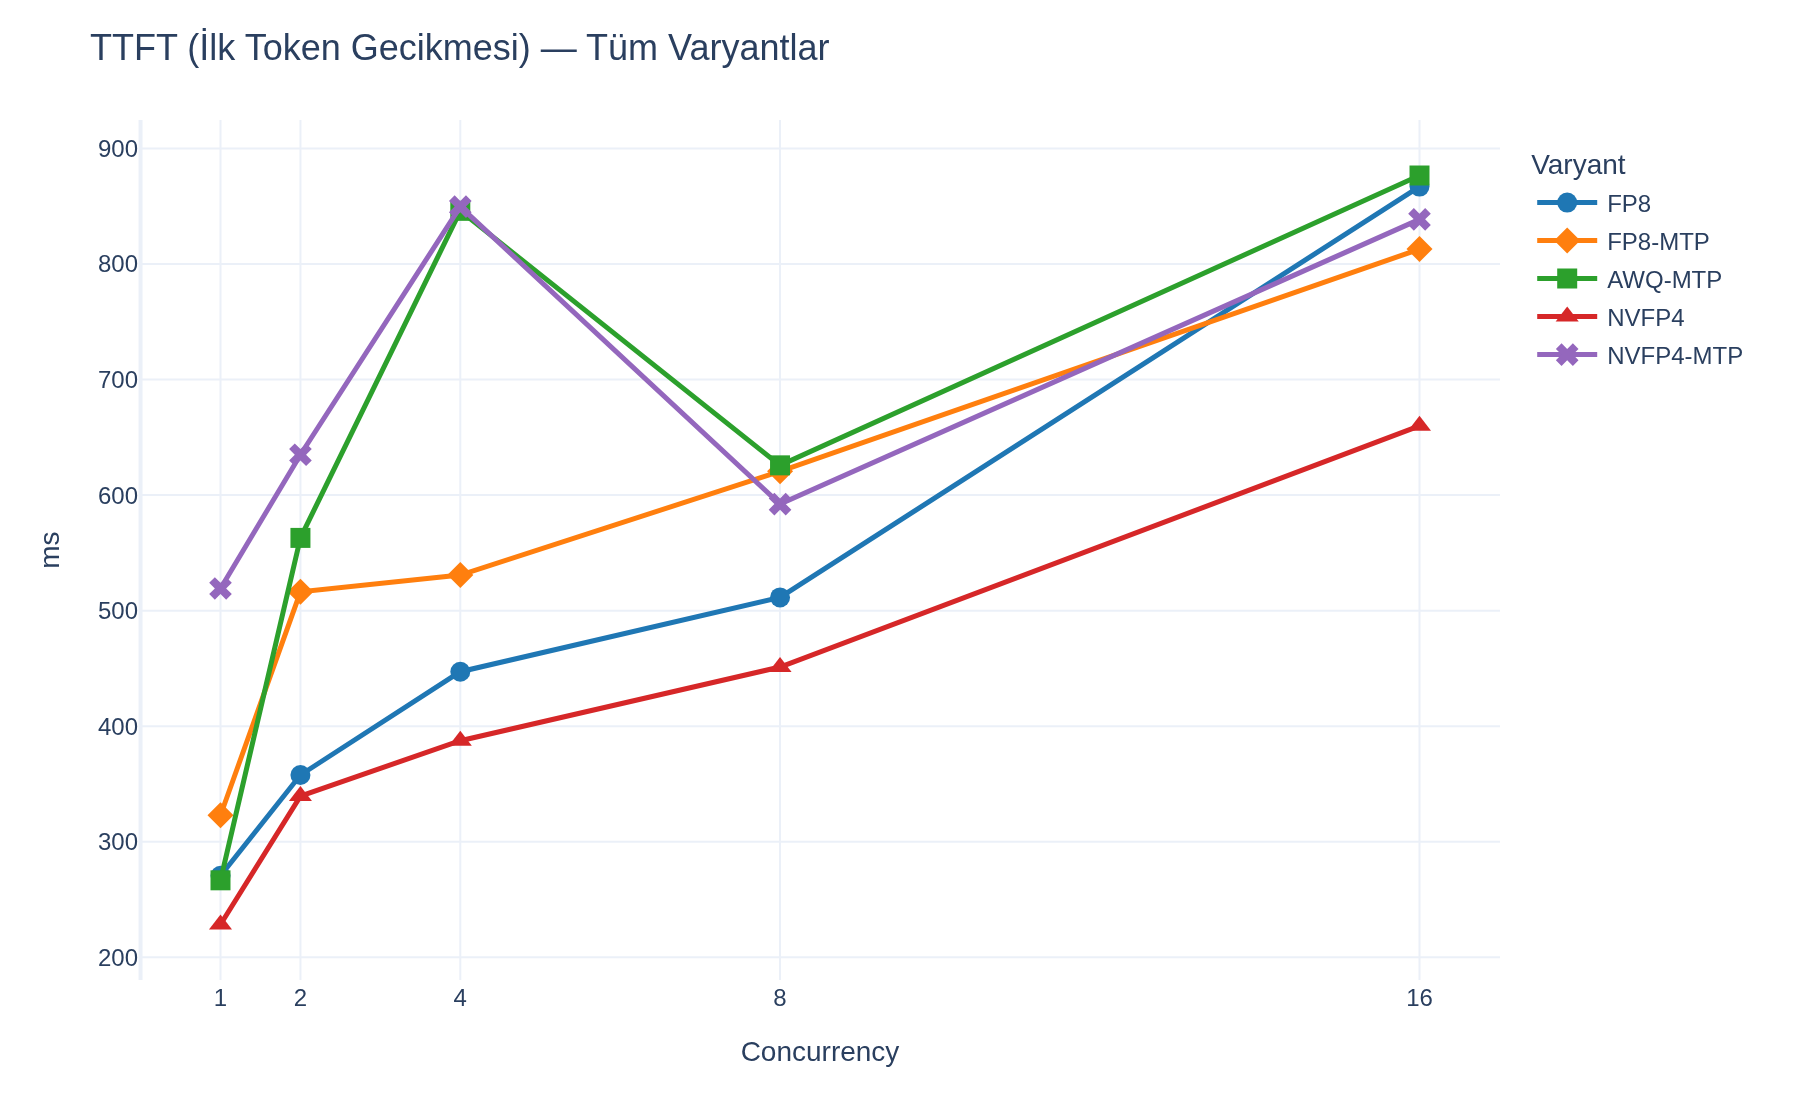
TTFT values follow an irregular trajectory (267ms, 563ms, 846ms, 626ms, 877ms). The rise to 846ms at Concurrency=4 and the drop to 626ms at C=8 suggests it is affected by system conditions or scheduling fluctuations during the test. Overall, the increase of TTFT with concurrency is due to the compute-bound nature of the prefill phase (see the prefill/decode bottleneck explanation in Section 2.1).
2.4 Qwen3.6-27B-NVFP4
NVIDIA’s 4-bit proprietary format. Comes with hardware-level acceleration support; MTP was not used.
Performance Table:
| Concurrency | TTFT (ms) | ITL (ms) | TPS (tok/s) | Latency (s) | Throughput (RPS) |
|---|---|---|---|---|---|
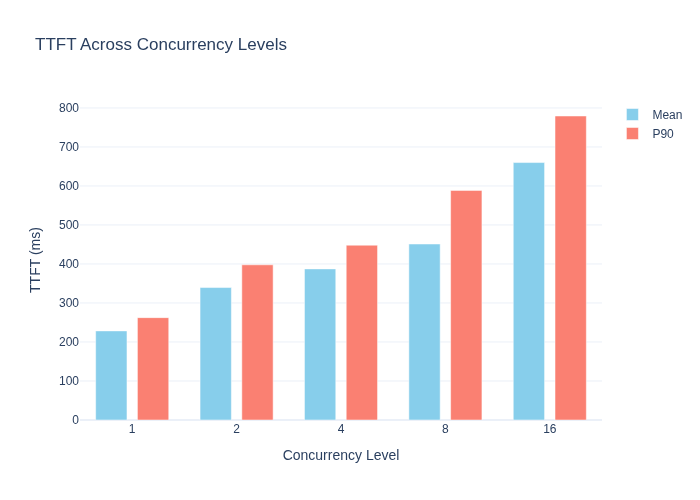
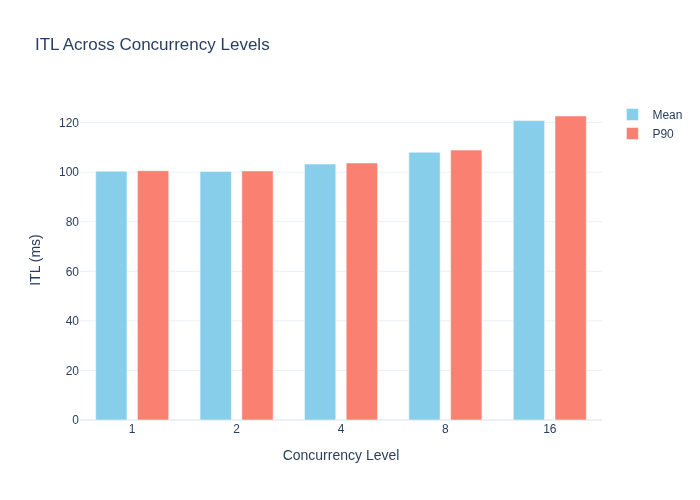
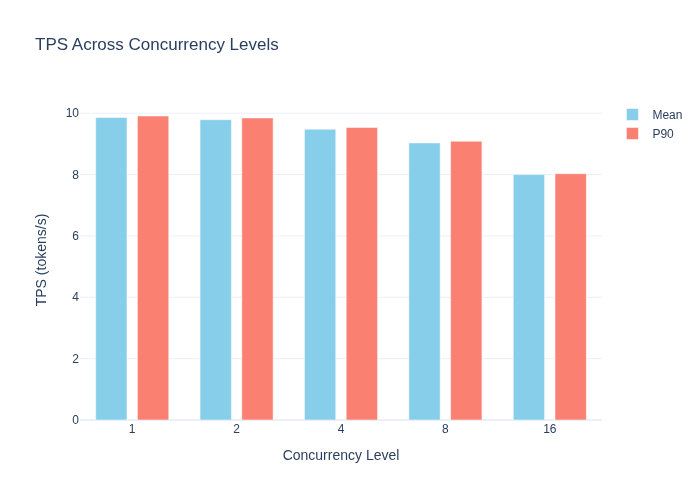
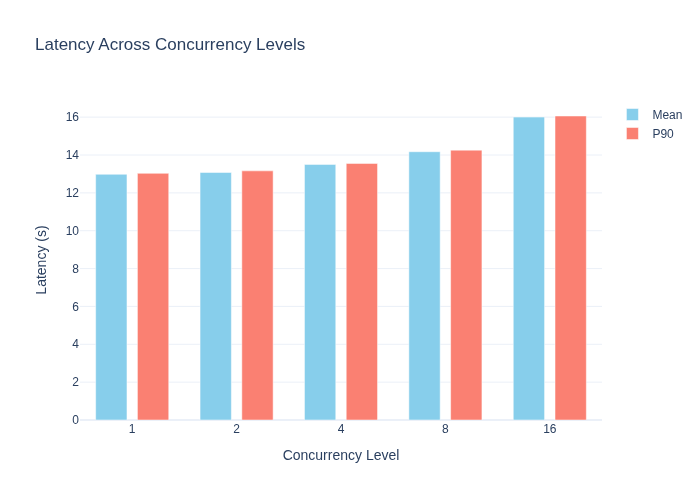
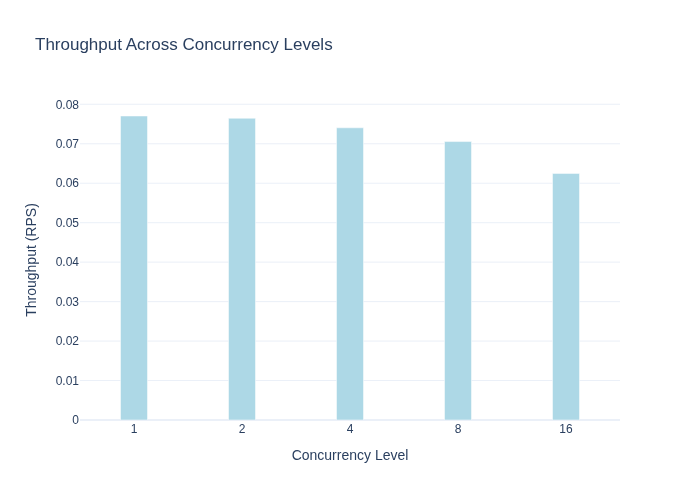
| 1 | 228.42 | 100.40 | 9.86 | 12.98 | 0.08 |
| 2 | 339.55 | 100.29 | 9.79 | 13.08 | 0.08 |
| 4 | 387.42 | 103.28 | 9.48 | 13.50 | 0.07 |
| 8 | 451.22 | 108.04 | 9.03 | 14.17 | 0.07 |
| 16 | 659.95 | 120.80 | 8.00 | 16.00 | 0.06 |
Evaluation:
NVFP4 consistently outperforms the FP8 variant. ITL ~100ms (vs ~122ms in FP8), TPS ~9.86 tok/s (vs ~8.13 in FP8), latency ~13s (vs ~15.75s in FP8). The memory bandwidth advantage of 4-bit compression, combined with hardware acceleration, surpasses FP8.
NVFP4’s TTFT values are the lowest among all variants (228ms @ C=1). This shows that NVFP4 benefits from hardware acceleration in the prefill phase.
Concurrency sensitivity is similar to FP8: TPS drops 19%, ITL increases 20%, latency increases 23%. Since both MTP-free models cannot fully saturate the GPU, the concurrency increase has a relatively mild effect — the bottleneck difference of low impact on ITL (decode memory-bound) and high impact on TTFT (prefill compute-bound) also applies here (see the explanation in Section 2.1).
2.5 Qwen3.6-27B-NVFP4-MTP
NVFP4 quantization + MTP combination. 4-bit compression and multi-token prediction are used together.
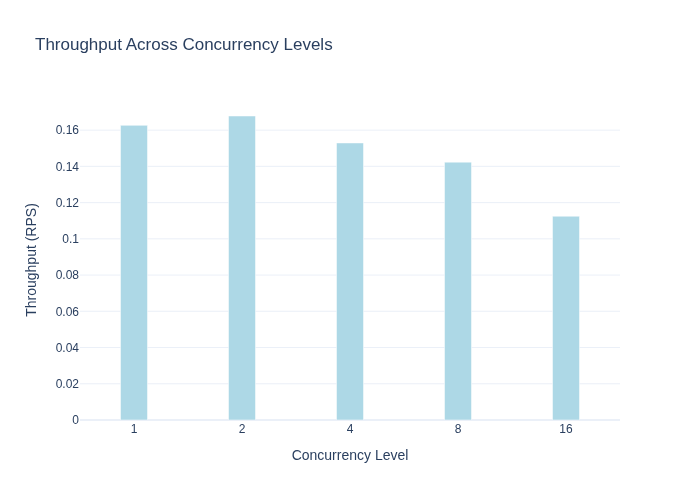
Performance Table:
| Concurrency | TTFT (ms) | ITL (ms) | TPS (tok/s) | Latency (s) | Throughput (RPS) |
|---|---|---|---|---|---|
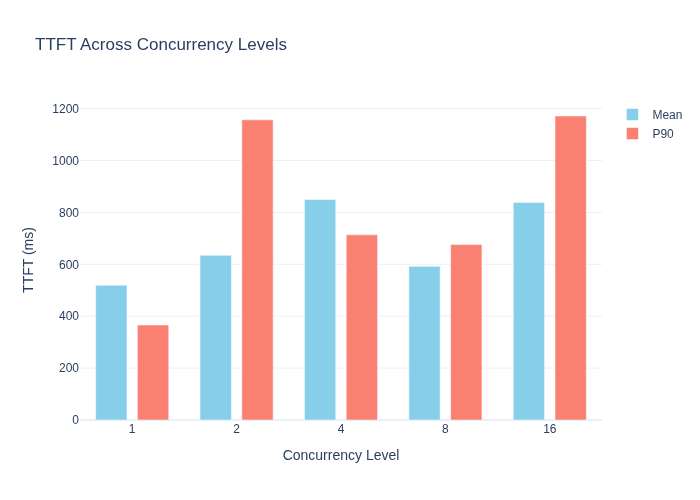
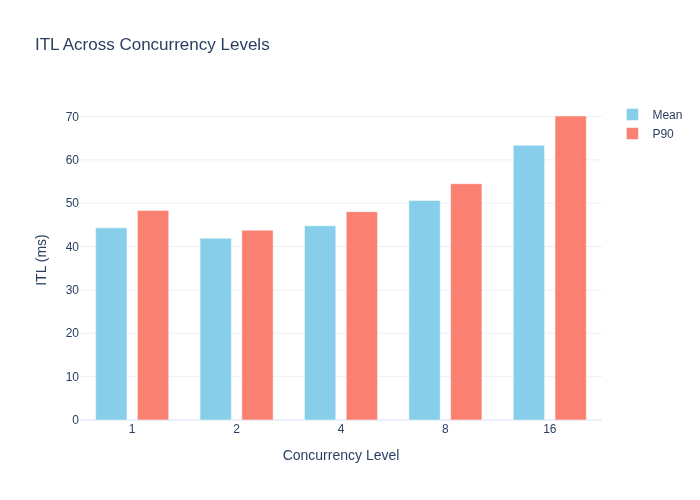
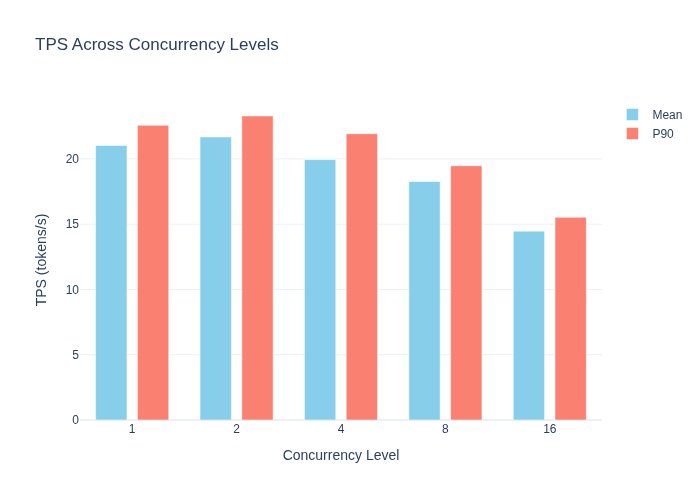
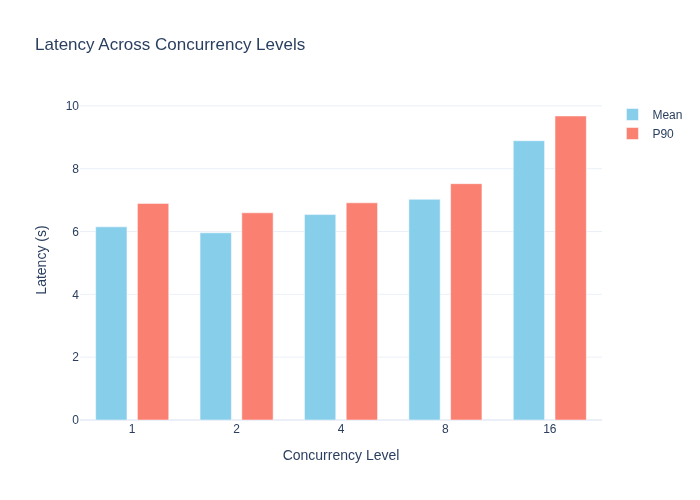
| 1 | 519.21 | 44.32 | 21.02 | 6.15 | 0.16 |
| 2 | 634.90 | 41.92 | 21.68 | 5.96 | 0.17 |
| 4 | 849.66 | 44.79 | 19.94 | 6.54 | 0.15 |
| 8 | 592.18 | 50.64 | 18.27 | 7.03 | 0.14 |
| 16 | 838.59 | 63.38 | 14.47 | 8.89 | 0.11 |
Evaluation:
NVFP4-MTP shows performance close to FP8-MTP. At Concurrency=1, TPS is 21.02 tok/s (FP8-MTP: 19.50), ITL is 44.32ms (FP8-MTP: 49.40ms), latency is 6.15s (FP8-MTP: 6.60s). When NVFP4’s memory bandwidth advantage is combined with MTP, it provides a small additional speed gain.
In terms of TTFT, NVFP4-MTP at Concurrency=1 has the highest value at 519ms among all variants. This marked difference indicates that the NVFP4+MTP configuration creates an additional computational load in the prefill phase. The user experiences the longest wait for the first token in this variant. Due to SM121 hardware constraints, the MTP+NVFP4 combination causes additional load in prefill (see Section 6.4.3 for details).
Concurrency sensitivity is similar to FP8-MTP: TPS drops 31%, ITL increases 43%, latency increases 45%. The marked increase in ITL with concurrency is due to memory bandwidth contention increasing as the GPU approaches saturation in the decode phase; the TTFT increase is due to the compute-bound nature of prefill (see the explanation in Section 2.1). The slight increase in TPS at Concurrency=2 (21.02 → 21.68) and decrease in latency (6.15s → 5.96s) are noteworthy; this may indicate a possible batching effect at C=2. However, the difference (~3% TPS) is within small-sample noise limits; more measurements are needed for a definitive “sweet spot” claim (see Section 1.7 Limitation).
3. Quantization Format Comparison
TTFT Comparison (All Variants):
3.1 Without MTP: FP8 vs NVFP4
Comparison of the two MTP-free variants across concurrency levels:
TPS (tokens/s) Comparison:
| Concurrency | FP8 | NVFP4 | Difference |
|---|---|---|---|
| 1 | 8.13 | 9.86 | +21.3% |
| 2 | 8.13 | 9.79 | +20.4% |
| 4 | 7.89 | 9.48 | +20.2% |
| 8 | 7.57 | 9.03 | +19.3% |
| 16 | 6.76 | 8.00 | +18.3% |
ITL (ms) Comparison:
| Concurrency | FP8 | NVFP4 | Difference |
|---|---|---|---|
| 1 | 121.87 | 100.40 | -17.6% |
| 2 | 121.13 | 100.29 | -17.2% |
| 4 | 124.23 | 103.28 | -16.9% |
| 8 | 129.14 | 108.04 | -16.3% |
| 16 | 142.24 | 120.80 | -15.1% |
Latency (s) Comparison:
| Concurrency | FP8 | NVFP4 | Difference |
|---|---|---|---|
| 1 | 15.75 | 12.98 | -17.6% |
| 2 | 15.74 | 13.08 | -16.9% |
| 4 | 16.23 | 13.50 | -16.8% |
| 8 | 16.91 | 14.17 | -16.2% |
| 16 | 18.93 | 16.00 | -15.5% |
Evaluation:
NVFP4 is consistently superior to FP8 across all metrics. The main reason for this advantage is that NVFP4’s 4-bit compression halves the memory bandwidth requirement. The LLM decode phase is a memory-bound workload; NVFP4, carrying less data, can feed the GPU’s compute units more efficiently.
The advantage ratio slightly narrows as concurrency increases (from 21.3% to 18.3% in TPS). This indicates that the memory bandwidth advantage diminishes as it approaches the limit of GPU compute resources under high load.
3.2 With MTP: FP8-MTP vs AWQ-MTP vs NVFP4-MTP
Comparison of the three MTP-enabled variants:
Concurrency=1 Comparison:
| Metric | FP8-MTP | AWQ-MTP | NVFP4-MTP |
|---|---|---|---|
| TPS (tok/s) | 19.50 | 25.45 | 21.02 |
| ITL (ms) | 49.40 | 37.57 | 44.32 |
| Latency (s) | 6.60 | 5.04 | 6.15 |
| TTFT (ms) | 322.95 | 266.65 | 519.21 |
| Throughput (RPS) | 0.15 | 0.20 | 0.16 |
Concurrency=16 Comparison:
| Metric | FP8-MTP | AWQ-MTP | NVFP4-MTP |
|---|---|---|---|
| TPS (tok/s) | 13.84 | 14.99 | 14.47 |
| ITL (ms) | 66.66 | 60.73 | 63.38 |
| Latency (s) | 9.28 | 8.59 | 8.89 |
| TTFT (ms) | 812.93 | 876.55 | 838.59 |
| Throughput (RPS) | 0.11 | 0.12 | 0.11 |
Evaluation:
AWQ-MTP is the clear leader at low concurrency. It is 30% faster than FP8-MTP and 21% faster than NVFP4-MTP in TPS. However, at high concurrency (C=16) the difference narrows significantly: AWQ-MTP’s TPS advantage drops to 8% over FP8-MTP and 3% over NVFP4-MTP.
This shows that AWQ’s memory bandwidth advantage is most effective under low load and that compute resources become the bottleneck as load increases. At high concurrency, all variants start to exhibit similar performance.
While NVFP4-MTP shows performance close to FP8-MTP, it has the worst values in terms of TTFT. This disadvantage should be considered in scenarios where first-token latency is critical (e.g., chatbots).
4. In-Depth Analysis of the MTP Effect
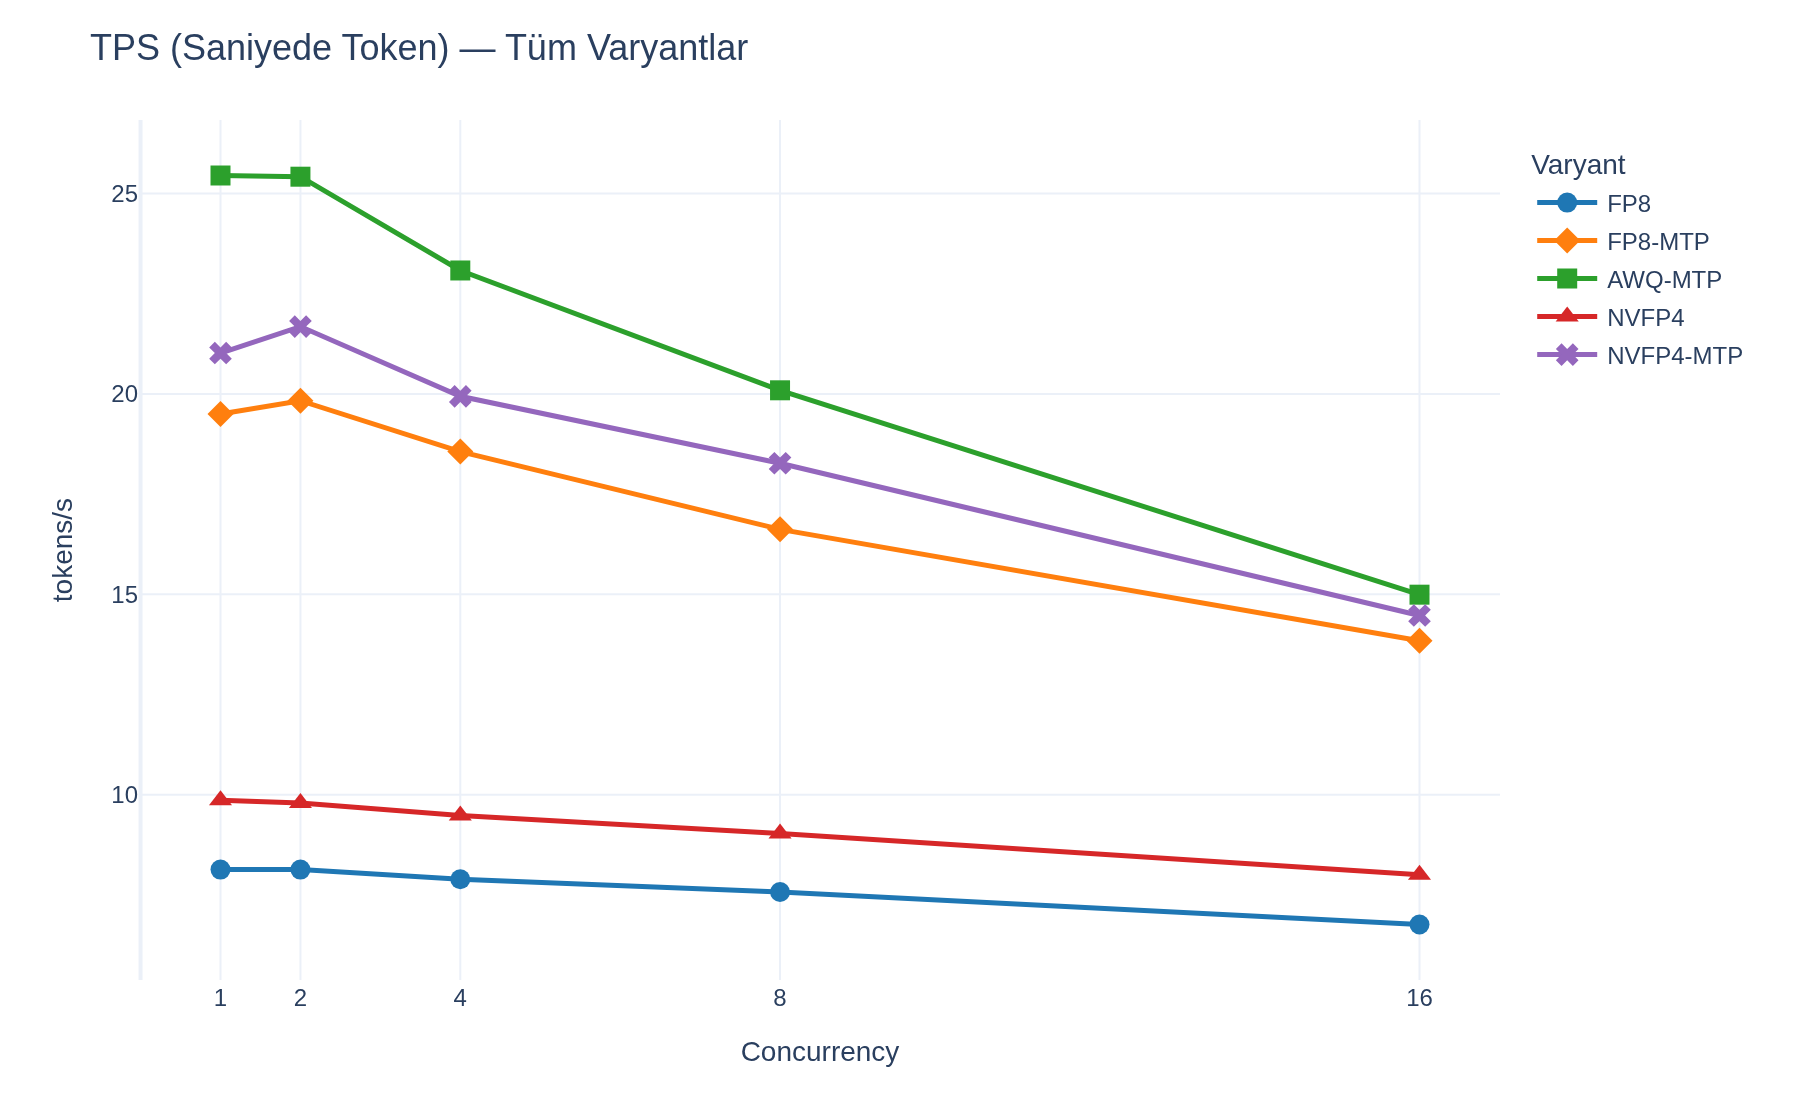
TPS Comparison (All Variants):
4.1 FP8 → FP8-MTP Conversion Effect
| Metric | FP8 (C=1) | FP8-MTP (C=1) | Change |
|---|---|---|---|
| TPS | 8.13 tok/s | 19.50 tok/s | +139.7% |
| ITL | 121.87 ms | 49.40 ms | -59.5% |
| Latency | 15.75 s | 6.60 s | -58.1% |
| TTFT | 270.57 ms | 322.95 ms | +19.4% |
| Throughput | 0.06 RPS | 0.15 RPS | +150.0% |
The effect of MTP on FP8 is consistent across all concurrency levels:
| Concurrency | TPS Increase | ITL Decrease | Latency Decrease |
|---|---|---|---|
| 1 | +139.7% | -59.5% | -58.1% |
| 2 | +143.5% | -61.3% | -58.8% |
| 4 | +135.2% | -59.6% | -57.4% |
| 8 | +119.4% | -56.6% | -54.3% |
| 16 | +104.7% | -53.1% | -51.0% |
Key finding: The speed gain of MTP decreases as concurrency increases. The TPS increase drops from 140% to 105%. This indicates that the additional computational load of MTP leads to resource contention under high load.
4.2 NVFP4 → NVFP4-MTP Conversion Effect
| Metric | NVFP4 (C=1) | NVFP4-MTP (C=1) | Change |
|---|---|---|---|
| TPS | 9.86 tok/s | 21.02 tok/s | +113.2% |
| ITL | 100.40 ms | 44.32 ms | -55.9% |
| Latency | 12.98 s | 6.15 s | -52.6% |
| TTFT | 228.42 ms | 519.21 ms | +127.3% |
| Throughput | 0.08 RPS | 0.16 RPS | +100.0% |
| Concurrency | TPS Increase | ITL Decrease | Latency Decrease |
|---|---|---|---|
| 1 | +113.2% | -55.9% | -52.6% |
| 2 | +121.3% | -58.2% | -54.4% |
| 4 | +110.3% | -56.7% | -51.6% |
| 8 | +102.3% | -53.1% | -50.4% |
| 16 | +80.9% | -47.5% | -44.4% |
Key finding: The negative effect of MTP on TTFT in NVFP4 is striking. TTFT rose from 228ms to 519ms (127% increase). This indicates that the NVFP4+MTP configuration creates significant additional load in the prefill phase. The user will experience a significant delay while waiting for the first token.
Additionally, MTP’s speed gain in NVFP4 is lower than in FP8 across all concurrency levels (TPS increase 113% vs 140%). This suggests that NVFP4’s hardware acceleration may not be fully compatible with MTP.
4.3 MTP Speedup Ratio vs Concurrency
The MTP-enabled / MTP-disabled TPS ratio shows how MTP’s benefit changes under load:
| Concurrency | FP8 MTP Ratio | NVFP4 MTP Ratio |
|---|---|---|
| 1 | 2.40x | 2.13x |
| 2 | 2.44x | 2.21x |
| 4 | 2.35x | 2.10x |
| 8 | 2.19x | 2.02x |
| 16 | 2.05x | 1.81x |
Evaluation:
In both quantization formats, the MTP speedup ratio decreases as concurrency increases. In FP8 it drops from 2.40x to 2.05x, and in NVFP4 from 2.13x to 1.81x. This proves that MTP provides the greatest benefit under low load conditions and that its return diminishes under high load.
The MTP ratio in NVFP4 is lower than in FP8 across all levels. This is because NVFP4 hardware acceleration is already more efficient in the MTP-free case, so MTP’s marginal contribution is smaller.
5. Analysis of the Concurrency Effect
5.1 TPS (Token Generation Rate) Drop
As concurrency increases, TPS drops in all variants:
| Variant | C=1 | C=2 | C=4 | C=8 | C=16 | Total Drop |
|---|---|---|---|---|---|---|
| FP8 | 8.13 | 8.13 | 7.89 | 7.57 | 6.76 | -17% |
| FP8-MTP | 19.50 | 19.83 | 18.56 | 16.62 | 13.84 | -29% |
| AWQ-MTP | 25.45 | 25.42 | 23.08 | 20.09 | 14.99 | -41% |
| NVFP4 | 9.86 | 9.79 | 9.48 | 9.03 | 8.00 | -19% |
| NVFP4-MTP | 21.02 | 21.68 | 19.94 | 18.27 | 14.47 | -31% |
Analysis:
- MTP-free models (FP8, NVFP4) exhibit low drop rates (17-19%). Since these models cannot use the GPU at full capacity, the concurrency increase can continue loading and individual TPS is not much affected.
- MTP-enabled models (FP8-MTP, AWQ-MTP, NVFP4-MTP) exhibit higher drop rates (29-41%). AWQ-MTP in particular has the highest rate with a 41% drop. This confirms that fast models saturate the GPU better and additional load leads to resource contention.
- The drop rate is similar between FP8-MTP and NVFP4-MTP (29% vs 31%), indicating that the GPU becomes saturated at a similar rate in both formats.
5.2 ITL (Inter-Token Latency) Increase
| Variant | C=1 | C=16 | Increase Rate |
|---|---|---|---|
| FP8 | 121.87 ms | 142.24 ms | +17% |
| FP8-MTP | 49.40 ms | 66.66 ms | +35% |
| AWQ-MTP | 37.57 ms | 60.73 ms | +62% |
| NVFP4 | 100.40 ms | 120.80 ms | +20% |
| NVFP4-MTP | 44.32 ms | 63.38 ms | +43% |
Analysis:
The ITL increase is a direct indicator of memory bandwidth contention. In MTP-enabled models, the ITL increase is markedly higher:
- 62% increase in AWQ-MTP: loading 4-bit weights uses high bandwidth; with MTP, this demand multiplies as multiple tokens are generated.
- Only 17% increase in FP8: GPU memory bandwidth still has capacity.
5.3 TTFT (First Token Latency) Increase
TTFT is the metric most affected by the concurrency increase:
| Variant | C=1 | C=16 | Increase Rate |
|---|---|---|---|
| FP8 | 270.57 ms | 866.95 ms | +220% |
| FP8-MTP | 322.95 ms | 812.93 ms | +152% |
| AWQ-MTP | 266.65 ms | 876.55 ms | +229% |
| NVFP4 | 228.42 ms | 659.95 ms | +189% |
| NVFP4-MTP | 519.21 ms | 838.59 ms | +61% |
Analysis:
- The 2-3x increase in TTFT shows that the prefill phase intensively uses GPU compute resources and serious queuing occurs under concurrent requests.
- The only 61% increase in NVFP4-MTP is noteworthy. However, this variant already has the highest starting TTFT (519ms); in absolute terms at C=16 it is 839ms, close to the other variants. (The 61% here is the effect of concurrency C=1→C=16; the 127% in Section 4.2 is the effect of adding MTP at fixed C=1 — the two ratios belong to different comparisons.)
- The prefill phase requires intensive matrix multiplications, including KV-cache creation. This phase is limited by compute power rather than memory bandwidth, and the sharing of the GPU’s compute units causes delay.
Practical impact: From the user’s perspective, as concurrency increases, the “time to start receiving response” can extend up to 3x. This directly negatively affects the user experience in interactive chat scenarios.
5.4 Total Latency Increase
| Variant | C=1 | C=16 | Increase Rate |
|---|---|---|---|
| FP8 | 15.75 s | 18.93 s | +20% |
| FP8-MTP | 6.60 s | 9.28 s | +40% |
| AWQ-MTP | 5.04 s | 8.59 s | +70% |
| NVFP4 | 12.98 s | 16.00 s | +23% |
| NVFP4-MTP | 6.15 s | 8.89 s | +45% |
Analysis:
Total latency is a combination of TTFT and decode time. Despite the large increase in TTFT, the increase in total latency is lower because the decode time (ITL × token count) is the dominant component.
The total latency increase is limited in MTP-free models (20-23%). In MTP-enabled models it ranges between 40-70%. AWQ-MTP has the highest rate with a 70% increase.
5.5 Total Throughput (RPS) Curve
| Variant | C=1 | C=2 | C=4 | C=8 | C=16 |
|---|---|---|---|---|---|
| FP8 | 0.06 | 0.06 | 0.06 | 0.06 | 0.05 |
| FP8-MTP | 0.15 | 0.15 | 0.14 | 0.13 | 0.11 |
| AWQ-MTP | 0.20 | 0.20 | 0.18 | 0.16 | 0.12 |
| NVFP4 | 0.08 | 0.08 | 0.07 | 0.07 | 0.06 |
| NVFP4-MTP | 0.16 | 0.17 | 0.15 | 0.14 | 0.11 |
Analysis:
The “Throughput (RPS)” value above is a per-request metric (1 / average_latency; see Section 1.5). It is independent of concurrency by definition; therefore, it appearing flat does not prove the GPU is not scaling — the metric structurally cannot increase with concurrency.
The system’s true total capacity is measured as Concurrency / average_latency (total RPS) or TPS × Concurrency (total tokens/s generated concurrently). Below is the system-wide RPS:
| Variant | C=1 | C=2 | C=4 | C=8 | C=16 |
|---|---|---|---|---|---|
| FP8 | 0.06 | 0.13 | 0.25 | 0.47 | 0.85 |
| FP8-MTP | 0.15 | 0.31 | 0.58 | 1.04 | 1.72 |
| AWQ-MTP | 0.20 | 0.40 | 0.70 | 1.25 | 1.86 |
| NVFP4 | 0.08 | 0.15 | 0.30 | 0.56 | 1.00 |
| NVFP4-MTP | 0.16 | 0.34 | 0.61 | 1.14 | 1.80 |
As can be seen, system-wide RPS increases markedly with concurrency (e.g., FP8-MTP: 0.15 at C=1 → 1.72 at C=16, ~11x; FP8: ~13x). This is consistent with the TPS × Concurrency table in Section 6.1.
Correct conclusion: Increasing concurrency on a single GPU significantly increases total work capacity; in exchange, individual request latency and TPS drop somewhat. That is, concurrency is a trade-off between latency and total throughput. Even though scaling efficiency decreases under load (83% for FP8 at C=16, 59% for AWQ-MTP; see Section 6.1), total capacity continues to increase.
6. Scalability and GPU Efficiency Analysis
6.1 Ideal Linear Scaling vs Actual Performance
If the GPU could scale perfectly, concurrency × TPS would be expected to remain constant. That is, at C=2 TPS should not drop by half, and at C=4 it should not drop to a quarter.
TPS × Concurrency (Total Token Generation Capacity):
| Concurrency | FP8 | FP8-MTP | AWQ-MTP | NVFP4 | NVFP4-MTP |
|---|---|---|---|---|---|
| 1 | 8.1 | 19.5 | 25.5 | 9.9 | 21.0 |
| 2 | 16.3 | 39.7 | 50.8 | 19.6 | 43.4 |
| 4 | 31.6 | 74.2 | 92.3 | 37.9 | 79.8 |
| 8 | 60.6 | 133.0 | 160.7 | 72.2 | 146.2 |
| 16 | 108.2 | 221.4 | 239.8 | 128.0 | 231.5 |
Note: This table is the measure of the system’s true total capacity and grows with concurrency (e.g., FP8: 8.1 → 108.2 tok/s, ~13x). It does not contradict the flat “Throughput (RPS)” curve in Section 5.5; since the metric there is per-request (
1/latency), it is fixed by definition. This table is the correct indicator of total capacity.
Ideal scaling (C=1 TPS × Concurrency):
| Concurrency | FP8 (Ideal) | FP8 (Actual) | Efficiency |
|---|---|---|---|
| 1 | 8.1 | 8.1 | 100% |
| 2 | 16.3 | 16.3 | 100% |
| 4 | 32.5 | 31.6 | 97.2% |
| 8 | 65.0 | 60.6 | 93.2% |
| 16 | 130.0 | 108.2 | 83.2% |
| Concurrency | AWQ-MTP (Ideal) | AWQ-MTP (Actual) | Efficiency |
|---|---|---|---|
| 1 | 25.5 | 25.5 | 100% |
| 2 | 50.9 | 50.8 | 99.8% |
| 4 | 101.8 | 92.3 | 90.7% |
| 8 | 203.6 | 160.7 | 78.9% |
| 16 | 407.2 | 239.8 | 58.9% |
Evaluation:
- FP8 scales relatively well, even at concurrency=16 with 83.2% efficiency. This is because the GPU has not yet reached full capacity due to its low individual TPS.
- AWQ-MTP drops to 58.9% efficiency at C=16. Since the GPU is intensively used, additional load directly leads to resource contention.
- These data show that each variant has a different “optimum concurrency” point.
6.2 GPU Saturation Map
Analysis showing how much each variant saturates the GPU at different concurrency levels:
Ratio of Individual TPS to C=1 (Saturation Index):
| Concurrency | FP8 | FP8-MTP | AWQ-MTP | NVFP4 | NVFP4-MTP |
|---|---|---|---|---|---|
| 1 | 100% | 100% | 100% | 100% | 100% |
| 2 | 100% | 102% | 100% | 99% | 103% |
| 4 | 97% | 95% | 91% | 96% | 95% |
| 8 | 93% | 85% | 79% | 92% | 87% |
| 16 | 83% | 71% | 59% | 81% | 69% |
How to read this table?
The saturation index is the ratio of the speed a request sees under concurrent load to the speed it would see if running alone on the GPU:
Saturation Index = (Individual TPS at level C) / (Individual TPS at C=1) × 100Concrete example (FP8, C=16): Total capacity 108.2 tok/s (Section 6.1 table) ÷ 16 requests ≈ 6.8 tok/s per request. Since the individual speed at C=1 is 8.1 tok/s, 6.8 / 8.1 ≈ 83%.
100% means C=1 performance is preserved — requests do not slow each other down, there is still idle capacity on the GPU. A drop indicates that requests have started contending for the same resources (especially memory bandwidth), i.e., the GPU is approaching saturation. Values like 102-103% at C=2 are measurement noise.
Important nuance: A low index does not mean a “bad variant”; while the index drops, total capacity continues to increase (e.g., despite AWQ-MTP dropping to 59% at C=16, with 239.8 tok/s total output it is more than double that of FP8). The practical use of the index is this: if the service SLA requires a minimum speed per user, the reasonable concurrency ceiling for each variant can be read from this table. This index is mathematically identical to the “Efficiency” column in Section 6.1; while 6.1 details the calculation for two variants, this table gathers all five variants in a single map.
Evaluation:
- AWQ-MTP drops to 79% at C=8 and 59% at C=16. The GPU has reached saturation and additional load causes serious performance loss.
- FP8 and NVFP4 are at 81-83% even at C=16. There is still compute capacity on the GPU; the bottleneck is in memory bandwidth.
- MTP-enabled variants have a lower saturation index at all levels because they use the GPU more efficiently and less idle capacity remains for additional load.
6.3 Bottleneck Identification: Prefill vs Decode
Bottleneck analysis based on the behavior of the two main phases under concurrency:
| Phase | Metric | C=1→C=16 Change | Bottleneck Type |
|---|---|---|---|
| Prefill | TTFT | 2-3x increase | Compute-bound |
| Decode | ITL | 17-62% increase | Memory bandwidth-bound |
Evaluation:
- The Prefill phase is compute-bound: All input tokens are processed at once, requiring intensive matrix multiplications. Concurrent requests must share the GPU’s SM (Streaming Multiprocessor) units.
- The Decode phase is memory bandwidth-bound: Only one (or a few with MTP) token is generated per step; the dominant operation is loading weights from GPU memory. More compressed formats (AWQ, NVFP4) alleviate this bottleneck by carrying less data.
Practical consequences:
- In long-prompt scenarios (long document summarization, etc.) the prefill bottleneck will dominate
- In short-prompt but long-response scenarios (code generation, creative writing) the decode bottleneck will dominate
- AWQ-MTP is the configuration that best resolves the decode bandwidth bottleneck
6.4 DGX Spark (SM121) Hardware Constraints and NVFP4 Performance
NVFP4 halves the memory bandwidth requirement compared to FP8 with 4-bit compression. Since the decode phase is memory-bound, this theoretically promises ~2x speedup. However, as seen in Section 3.1, NVFP4 is only 21-18% faster than FP8. This section examines from hardware and software perspectives why NVFP4 cannot realize its theoretical speedup.
6.4.1 SM121 vs SM100 Architecture Comparison
DGX Spark has the GB10 SoC, where the NVIDIA Grace (ARM64) CPU and Blackwell GPU are on the same package. The system uses 128 GB LPDDR5x (273 GB/s) unified memory shared between the CPU and GPU; there is no separate VRAM. The GPU is based on the SM 12.1 (compute capability) architecture and contains 48 SMs and 6.144 CUDA cores. There are 4 tensor cores per SM by conventional counting (≈192 total); however, unlike the data center Blackwell (SM100)’s 5th generation tcgen05 + TMEM infrastructure, they only operate via the warp-level mma.sync path.
Data center Blackwell GPUs (B200, GB200) are based on the SM 10.0 (compute capability) architecture. Although both architectures are referred to as “Blackwell,” their tensor core infrastructures differ significantly:
| Feature | SM100 (B200, CC 10.0) | SM121 (DGX Spark/GB10, CC 12.1) | Source |
|---|---|---|---|
FP4 mma.sync (e2m1) |
— | ✅ Supported | PTX ISA §9.7.15.5.14 [1] |
tcgen05.mma (5th gen TC path) |
✅ Supported | ❌ Not supported | PTX ISA §9.7.17.7.1 [2] |
| Tensor Memory (TMEM) | 256 KB | None | PTX ISA §9.7.17.1 [3] |
| CTA Pairs / Cooperative MMA | ✅ Supported | ❌ Not supported | PTX ISA §9.7.17.5.1 [4] |
| SMEM / SM (max) | 228 KB | 128 KB | Blackwell Tuning Guide [5] |
| SMEM / thread block (max) | 227 KB | 99 KB | Blackwell Tuning Guide [5] |
| SM count | 148 (active; 160 physical) | 48 | deviceQuery / TechPowerUp [5] |
| Tensor core / SM | 4 (5th gen, tcgen05) |
4 (warp-level mma.sync) |
CUDA PG / TechPowerUp [5] |
| FP4 peak (with sparsity) | ~9 PFLOP | ~1 PFLOP | NVIDIA spec |
| Memory bandwidth | ~8 TB/s (HBM3e) | 273 GB/s (LPDDR5x) | NVIDIA spec |
DGX Spark (SM121) has Blackwell FP4 tensor cores and the mma.sync.aligned.m16n8k64.f32.e2m1.e2m1 instruction runs at the hardware level. SM121 belongs to the compute_120f family, covering CC 12.0 and 12.1 [1], [6]. However, unlike data center Blackwell GPUs (SM100), the full 5th generation tensor core infrastructure is not available on SM121: the tcgen05.mma instruction set [2], Tensor Memory [3], and CTA Pairs/Cooperative MMA [4] are not supported on SM121.
6.4.2 Why Can’t NVFP4 Realize Theoretical Speedup?
The reasons NVFP4 cannot reach its theoretical potential on SM121 are both hardware and software related:
1. Lack of TMEM and SMEM pressure:
On SM100, 256KB TMEM allows FP4 kernels to keep intermediate results outside SMEM. On SM121, there is no TMEM; all intermediate data must fit into the 99KB SMEM per block. NVFP4’s block-scaled format requires keeping E2M1 weights and FP8 block scales in SMEM simultaneously. The default CUTLASS FP4 tile sizes designed for SM100 exceed SM121’s 99KB SMEM per block limit; community measurements confirm that tile sizes need to be reduced to fit this budget (BTankut’s tile sweep: 256×128 ≈154 TFLOPS for prefill/large batch, 128×128 ≈147 TFLOPS for decode/small batch are the best results [10]). This reduction leads to lower arithmetic intensity and earlier encounter with the memory bandwidth limit.
2. Lack of tcgen05.mma:
tcgen05.mma is the PTX instruction that dispatches FP4 matrix multiplications most efficiently [2]. On SM121, only mma.sync.aligned.m16n8k64.f32.e2m1.e2m1 can be used; CUTLASS has to go through the CuTe API abstraction path.
3. Lack of CTA Pairs / Cooperative MMA:
On SM100, two SMs can combine to execute a single MMA operation [4]. On SM121, this cooperation mechanism is not available.
4. Fewer SMs and weaker tensor core path:
While SM100 (B200) has 148 active SMs, DGX Spark (SM121) contains only 48 SMs (~3x difference). Additionally, SM100’s 5th generation tcgen05 + TMEM tensor core infrastructure is absent on SM121; SM121 falls back to the warp-level mma.sync path [5]. These two factors together limit FP4 peak compute capacity to ~1 PFLOP (SM121) vs ~9 PFLOP (SM100) (see Appendix A.1-4).
5. Memory bandwidth:
273 GB/s LPDDR5x (SM121) vs ~8 TB/s HBM3e (SM100). Since the decode phase is memory-bound, NVFP4’s 4-bit compression saves bandwidth on both platforms; however, DGX Spark’s low bandwidth causes the compute speedup to hit the bandwidth limit and NVFP4’s compute advantage to be lost.
6. E2M1 activation quantization overhead:
In W4A4 (weights and activations 4-bit) operating mode, NVFP4 requires activations to be converted from BF16 to E2M1 at runtime. On SM121, the cvt.rn.satfinite.e2m1x2.f32 PTX instruction can be used with the correct compile flags (sm_121a); however, vLLM v0.22.0’s CMake process does not pass these flags correctly (see Section 6.4.4).
6.4.3 Why is MTP + NVFP4 Problematic?
The NVFP4+MTP configuration, as examined in Section 2.5, has the highest TTFT value (519ms). The reasons:
- MTP brings additional computational load per decode step (multiple token generation + verification)
- NVFP4’s SMEM constraints make it harder to absorb the additional computational load added by MTP
- The prefill phase is compute-bound (Section 6.3); while the NVFP4+MTP combination increases the load in this phase, the lack of tcgen05 and SMEM constraints cannot provide additional compute capacity
- Result: 127% increase in TTFT (NVFP4 without MTP 228ms → NVFP4-MTP 519ms)
6.4.4 Software-Side Deficiencies
In addition to hardware constraints, NVFP4’s software support on SM121 is also incomplete. These deficiencies exacerbate the impact of hardware constraints:
| Issue | Description | Status |
|---|---|---|
CMake sm_121a suffix removal |
vLLM compiles as sm_121a → sm_120, E2M1 PTX disabled |
Fixed with PR #37725 [7] |
| SM121 capability gate error | cuda_device_capability >= 110 check invalidates SM121 (121) |
Fixed with PR #38126 [8] |
| E2M1 software conversion missing | When cvt.rn.satfinite.e2m1x2.f32 is not compiled correctly, no software fallback |
Upstreamed with PR #35947 [9] |
| CUTLASS tile sizes not optimized for SM121 | Default tiles designed for SM100’s 228KB SMEM | Community solution available (BTankut) [10] |
| MoE grouped GEMM kernel missing | No kernel optimized for SM121 | FlashInfer PR #2650 in progress [11] |
| MTP + NVFP4 constraint | In vLLM, MTP head is not loaded in certain NVFP4+MTP paths (not a universal ban, path-dependent) | Solvable with workaround keeping MTP head in BF16 / Avarok patch [12] |
Source: vLLM Issue #37141 — Upstream DGX Spark improvements from Avarok-Cybersecurity/dgx-vllm
NVFP4’s software support on SM121 is not yet mature; however, community solutions can significantly improve NVFP4 performance. Avarok-Cybersecurity offers an optimized Docker image with Marlin W4A16 backend and software E2M1 conversion [12]. BTankut provides improvements with CUTLASS tile tuning and SM121 admissible_archs patches [10]. Efforts are ongoing to upstream these developments into vLLM [vLLM Issue #37141]. However, the lack of tcgen05, TMEM, and CTA Pairs creates a hardware-based ceiling that software improvements cannot exceed.
All measurements in this report were taken with the stock vllm/vllm-openai:v0.22.0-ubuntu2404 image, without the aforementioned community patches applied. Therefore, the NVFP4 and NVFP4-MTP results here reflect the current upstream state; improvements can be expected with the patches applied (see Appendix A.3 for quantitative estimates).
6.4.5 References
[1] NVIDIA, PTX ISA v9.3, Section 9.7.15.5.14 — Multiply-and-Accumulate Instruction: mma. “.e2m1 alternate floating point type mma operation requires sm_120a and is supported on sm_120f from PTX ISA version 8.8.” https://docs.nvidia.com/cuda/parallel-thread-execution/index.html#warp-level-matrix-instructions-mma
[2] NVIDIA, PTX ISA v9.3, Section 9.7.17.7.1 — tcgen05 Memory Alloc/Manage Instructions. Supported architectures: sm_100a, sm_101a, sm_100f, sm_110f. SM120/SM121 not in the list. https://docs.nvidia.com/cuda/parallel-thread-execution/index.html#tcgen05-memory-alloc-manage-instructions
[3] NVIDIA, PTX ISA v9.3, Section 9.7.17.1 — Tensor Memory. “On architecture sm_100a/sm_100f, the 5th generation TensorCore’s Tensor Memory has a two-dimensional structure of 512 columns and 128 rows per CTA, each cell 32-bits.” No TMEM definition for SM120/SM121. https://docs.nvidia.com/cuda/parallel-thread-execution/index.html#tensor-memory
[4] NVIDIA, PTX ISA v9.3, Section 9.7.17.5.1 — CTA Pair. “Any 2 CTAs within the cluster whose %cluster_ctarank differs by the last bit only is said to form a CTA pair.” CTA Pairs are part of the tcgen05 instruction family; not valid on architectures that do not support tcgen05. https://docs.nvidia.com/cuda/parallel-thread-execution/index.html#tcgen05-cta-pair
[5] NVIDIA, Blackwell Tuning Guide — SMEM limits: CC 10.0 = 228 KB/SM, 227 KB/block; CC 12.0/12.1 = 128 KB/SM, 99 KB/block. Also CUDA C++ Programming Guide Section 20.9/20.10. B200 SM and tensor core counts (148 active SMs, 592 tensor cores; 160 physical SMs) from TechPowerUp B200 database; DGX Spark 48 SM value confirmed from deviceQuery output. https://docs.nvidia.com/cuda/blackwell-tuning-guide/index.html · https://docs.nvidia.com/cuda/cuda-c-programming-guide/index.html
[6] NVIDIA, CUDA C++ Programming Guide, Table 25 — Family-Specific Compatibility. “compute_120f: Compatible with Compute Capability 12.0, 12.1.” https://docs.nvidia.com/cuda/cuda-c-programming-guide/index.html#feature-availability
[7] RobTand, vLLM PR #37725 — Preserve CUDA arch suffix (a/f) for SM12x — fixes NVFP4 NaN on desktop Blackwell. https://github.com/vllm-project/vllm/pull/37725
[8] johnnynunez, vLLM PR #38126 — Fix DGX Spark logic. https://github.com/vllm-project/vllm/pull/38126
[9] blake-snc, vLLM PR #35947 — Software E2M1 conversion for SM12x NVFP4 activation quantization. https://github.com/vllm-project/vllm/pull/35947
[10] NVIDIA Developer Forums, FP4 on DGX Spark — Why It Doesn’t Scale Like You’d Expect. BTankut CUTLASS tile tuning results. https://forums.developer.nvidia.com/t/fp4-on-dgx-spark-why-it-doesnt-scale-like-youd-expect/360142
[11] kahyunnam, FlashInfer PR #2650 — Enable sm120f compilation. https://github.com/flashinfer-ai/flashinfer/pull/2650
[12] Avarok-Cybersecurity, dgx-vllm GitHub. NVFP4 DGX Spark improvements. https://github.com/Avarok-Cybersecurity/dgx-vllm
7. Tail Latency and Stability
7.1 p90/p50 Ratios
The p90/p50 ratio indicates the tail thickness of the latency distribution. If the ratio is close to 1.0, the distribution is tight and predictable; if high, some requests complete much slower than expected.
ITL p90/p50 Ratios:
| Variant | C=1 | C=4 | C=8 | C=16 |
|---|---|---|---|---|
| FP8 | 1.00 | 1.00 | 1.01 | 1.02 |
| FP8-MTP | 1.05 | 1.06 | 1.10 | 1.08 |
| AWQ-MTP | 1.05 | 1.08 | 1.11 | 1.11 |
| NVFP4 | 1.00 | 1.00 | 1.01 | 1.02 |
| NVFP4-MTP | 1.12 | 1.08 | 1.08 | 1.12 |
TTFT p90/p50 Ratios:
| Variant | C=1 | C=4 | C=8 | C=16 |
|---|---|---|---|---|
| FP8 | 1.20 | 1.28 | 1.08 | 1.19 |
| FP8-MTP | 1.02 | 1.05 | 1.08 | 1.13 |
| AWQ-MTP | 1.35 | 1.15 | 1.24 | 1.29 |
| NVFP4 | 1.13 | 1.15 | 1.29 | 1.11 |
| NVFP4-MTP | 1.02 | 1.42 | 1.15 | 1.56 |
TPS p90/p50 Ratios:
| Variant | C=1 | C=4 | C=8 | C=16 |
|---|---|---|---|---|
| FP8 | 1.00 | 1.01 | 1.01 | 1.01 |
| FP8-MTP | 1.11 | 1.06 | 1.07 | 1.07 |
| AWQ-MTP | 1.07 | 1.10 | 1.08 | 1.09 |
| NVFP4 | 1.01 | 1.01 | 1.01 | 1.00 |
| NVFP4-MTP | 1.03 | 1.08 | 1.06 | 1.07 |
Evaluation:
- ITL stability: MTP-free models (FP8, NVFP4) have near-perfect stability (p90/p50 ≈ 1.00-1.02). In MTP-enabled models the ratio ranges from 1.05-1.12. This indicates that MTP causes fluctuations in the acceptance rate of token generation.
- TTFT stability: The highest fluctuation is observed in NVFP4-MTP (1.56 at C=16). This indicates that the NVFP4+MTP configuration exhibits unpredictable behavior in the prefill phase. AWQ-MTP also shows high fluctuation (1.29-1.35).
- TPS stability: It is at acceptable levels across all variants (1.00-1.11). Since TPS is the inverse of ITL, similar ratios are expected; however, the measurement average is more stable.
7.2 Which Variant is More Predictable?
Ranking (from most predictable to least predictable):
- NVFP4 — Excellent stability in ITL and TPS, medium in TTFT
- FP8 — Close to NVFP4, low fluctuation across all metrics
- FP8-MTP — Medium in ITL and TPS, good stability in TTFT
- AWQ-MTP — Medium in ITL, high fluctuation in TTFT
- NVFP4-MTP — Highest fluctuation in ITL, highest fluctuation in TTFT
7.3 Latency Fluctuation Under Load
The main reason for the increased fluctuation in MTP-enabled models is MTP’s working mechanism:
- Multiple tokens are generated per step, but some are rejected
- The rejection rate varies depending on context and model state
- In steps with high rejection rate, effective TPS drops and ITL increases
- This causes the p90/p50 ratio to rise
The high TTFT fluctuation observed especially in NVFP4-MTP (p90/p50 = 1.56 @ C=16) suggests that this configuration may pose a risk for critical applications; however, this value may have been affected by the limited sample size (see Section 1.7 Limitation) and should be confirmed with a higher request count before an SLA decision. In systems with SLA requirements (e.g., “99% of requests must respond within 1 second”), this fluctuation should be taken into account.
8. Optimal Operating Point and Recommendations
8.1 Variant Selection Guide
| Scenario | Recommended Variant | Concurrency | Rationale |
|---|---|---|---|
| Interactive chatbot | AWQ-MTP | 1-2 | Lowest latency (5.04s), highest TPS (25.45). User gets a fast response. |
| Code assistant (autocomplete) | AWQ-MTP | 1-2 | Low TTFT (267ms) + high TPS. Instant suggestions are critical while coding. |
| API service (low load) | AWQ-MTP | 1-4 | Even at C=4, 23 tok/s TPS and 5.68s latency are acceptable. |
| API service (high load) | NVFP4-MTP | 8-16 | Total throughput increases with concurrency (system-wide 231 tok/s at C=16); NVFP4-MTP offers throughput close to AWQ-MTP under high load with more balanced scaling. |
| Batch processing | NVFP4-MTP or FP8-MTP | 8-16 | What matters in batch processing is total tokens/s; at C=16, MTP-enabled variants reach ~221-232 tok/s, approximately double that of MTP-free ones (~108-128) (see Section 6.1). |
| SLA-requiring system | FP8 or NVFP4 | 1-4 | Lowest fluctuation. p90/p50 ≈ 1.0. Predictable performance is critical. |
| First token latency critical | NVFP4 | 1-2 | Lowest TTFT (228ms). User sees a response immediately. |
| Memory-constrained environment | NVFP4-MTP | 1-4 | 4-bit compression + MTP provides the lowest memory footprint + high speed. (On DGX Spark, memory is shared between CPU-GPU; low footprint leaves room for other workloads.) |
8.2 Optimal Concurrency Levels
For each variant, the optimal balance point between individual request performance and total throughput:
Optimal concurrency depends on what you are optimizing; there is no single “correct” value:
| Variant | Optimal C for Latency | Optimal C for Throughput | Note |
|---|---|---|---|
| FP8 | 1-2 | 8-16 | Scaling efficiency 83% at C=16; system-wide RPS 0.06 → 0.85. |
| FP8-MTP | 1-2 | 8-16 | System-wide RPS 1.72 at C=16 (~11x). |
| AWQ-MTP | 1-2 | 4-8 | Highest per-request speed; scaling efficiency drops rapidly at C≥8 (59%). |
| NVFP4 | 1-2 | 8-16 | Most stable variant; system-wide RPS 1.00 at C=16. |
| NVFP4-MTP | 1-2 | 8-16 | TPS/latency improves slightly at C=2 (difference within noise limit; see Section 1.7); system-wide RPS 1.80 at C=16. |
General rule:
- Latency-critical / single user (chatbot, code assistant): C=1-2. The individual request gets the fastest response here.
- Throughput-critical / multi-user service (API, batch): C=8-16. System-wide capacity (total RPS and tokens/s) increases ~9-13x with concurrency (see Sections 5.5 and 6.1); in exchange, per-request latency/TPS drops somewhat.
As explained in Section 5.5, the impression that “concurrency does not increase total capacity” stems from misreading the measurement tool’s per-request “Throughput (RPS)” metric (1/latency). In reality, the GPU does not saturate on a single request; batching significantly increases system throughput. However, scaling efficiency drops under load (83% for FP8 at C=16, 59% for AWQ-MTP), so the return is not unlimited — therefore, even in throughput-critical scenarios, attention should be paid to tail latency increase at very high concurrency.
8.3 Quantization Selection Recommendations
Why is AWQ-MTP the performance winner?
AWQ quantizes weights to 4-bit while keeping activations at full precision. This balances memory bandwidth savings with model accuracy. When combined with MTP:
- Memory bandwidth pressure is alleviated in the decode phase (smaller weights)
- MTP generates multiple tokens and most are accepted
- Net result: ITL drops 69%, TPS increases 213% (relative to FP8 baseline)
It should be emphasized that this “winner” designation is based solely on speed metrics; accuracy measurement is outside the scope of this work and should be done separately before a production decision.
But AWQ’s risks:
- 4-bit quantization may cause loss in model accuracy. This benchmark does not include accuracy measurement; model quality should be evaluated separately for both AWQ and NVFP4. (The NVFP4 variant is calibrated on UltraChat with a ~2M token budget; see Section 1.3.)
- Performance drop is steeper at high concurrency (41%)
- TTFT fluctuation is higher
When should NVFP4-MTP be preferred?
- When wanting to fully benefit from hardware acceleration on NVIDIA Blackwell GPUs
- In memory-constrained environments (lowest memory footprint)
- Under low-to-medium load (C≤4)
Forward-looking note: The AWQ-MTP superiority in this report is a snapshot of unpatched stock vLLM v0.22.0. As the software fixes in Section 6.4.4 enter upstream, NVFP4-MTP is expected to reach parity with AWQ-MTP, and to surpass it at high concurrency (see Appendix A.3 for quantitative analysis). If long-lived installations are planned on DGX Spark, NVFP4, the hardware-native format, should be considered as the strategic choice.
9. Conclusion
9.1 Summary of Key Findings
-
MTP provides dramatic speedup: TPS increases 140% in FP8 and 113% in NVFP4. Latency drops by more than half. MTP is the most effective technique that improves performance at a transformational level on DGX Spark.
-
AWQ-MTP is the fastest variant: 25.45 tok/s (C=1), 37.57ms ITL, 5.04s latency. The combination of memory bandwidth savings + MTP creates a unique speed advantage in the decode phase. (Note: this evaluation is speed-based only; accuracy was not measured.)
-
NVFP4 is consistently superior to FP8: In the MTP-free comparison, TPS is 21% higher, ITL is 18% lower, and latency is 18% lower. The bandwidth advantage of 4-bit compression is evident.
-
Concurrency is a latency–throughput trade-off: Increasing concurrency somewhat reduces individual request performance (latency, per-request TPS); however, it significantly increases system-wide total capacity (total tokens/s and RPS ~13x in FP8, ~9-11x in MTP-enabled variants). Note: Since the measurement tool’s “Throughput (RPS)” metric is per-request (
1/latency), it is independent of concurrency by definition; system capacity is measured asTPS × Concurrency(see Sections 5.5, 6.1). Scaling efficiency still decreases under load (59-83% at C=16). -
TTFT is the most sensitive metric: It rises 2-3x with concurrency increase. The prefill phase is compute-bound and serious delays occur under concurrent requests.
-
MTP’s benefit decreases under load: The TPS speedup ratio drops from 2.40x (C=1) to 2.05x (C=16) in FP8. In NVFP4 it drops from 2.13x to 1.81x.
-
MTP-free models are more stable: p90/p50 ratios are ~1.00 in ITL and ~1.15 in TTFT. In MTP-enabled models, ITL ~1.05-1.12, TTFT ~1.02-1.56.
-
NVFP4’s current lag is not permanent: All measurements were taken with stock vLLM v0.22.0 without community patches applied. When the software fixes in Section 6.4.4 are applied, NVFP4-MTP is expected to catch up to AWQ-MTP and surpass it under high load — even at C=16 the difference is only ~3.5% today (see Appendix A.3).
Appendix A: Quantitative Impact of SM121 Hardware Deficiencies
Section 6.4 explains from hardware and software perspectives why NVFP4 cannot reach its theoretical potential on SM121. However, the concrete performance counterpart of each deficiency has not been given quantitatively. This appendix concretizes the impact of each of the aforementioned deficiencies on NVFP4 performance.
A.1 Concrete Performance Counterpart of Hardware Deficiencies
1. Lack of TMEM → tile reduction necessity
On SM100, 256KB TMEM + 228KB SMEM = a total of 484KB intermediate data area is available. On SM121, there is no TMEM; all intermediate data must fit into the 99KB SMEM per block. The default CUTLASS FP4 tile sizes designed for SM100 exceed this 99KB budget (confirmed by community measurements [10]), so the tile size must be reduced:
- Smaller tile = lower arithmetic intensity (compute/bandwidth ratio)
- Low arithmetic intensity = earlier encounter with memory bandwidth limit
- Result: The bandwidth savings provided by NVFP4’s 4-bit compression cannot be realized because the compute units are not fed sufficiently
2. Lack of tcgen05.mma → no efficient dispatch mechanism
tcgen05.mma is the PTX instruction on SM100 that directly dispatches FP4 GEMM to the tensor core in a single instruction. On SM121, only mma.sync.aligned.m16n8k64.f32.e2m1.e2m1 can be used. CUTLASS has to go through the CuTe API abstraction layer:
- More register management overhead
- More SMEM management overhead
- Less optimal scheduling (manual software-level pipelining instead of tcgen05’s hardware-level automatic pipelining)
3. Lack of CTA Pairs / Cooperative MMA → SM cooperation impossible
On SM100, two SMs can combine to execute a single MMA operation (CTA Pair). This is a critical capability for large tile sizes: matrix multiplications too large for a single SM to process alone can be divided between two SMs. On SM121, each SM must work in isolation:
- Large matrix multiplications must be divided into smaller pieces
- Partitioning overhead: separate SMEM loading, separate synchronization for each piece
- Work done with a single CTA Pair on SM100 is done with multiple independent CTAs on SM121 → additional coordination cost
4. Fewer SMs and absence of 5th generation tensor core infrastructure → ~9x difference in total FP4 compute capacity
| Architecture | SM Count | Tensor Cores / SM | Total Tensor Cores | Tensor core path | FP4 Peak (with sparsity) |
|---|---|---|---|---|---|
| SM100 (B200) | 148 (active) | 4 | 592 | 5th gen tcgen05 + TMEM |
~9 PFLOP |
| SM121 (DGX Spark) | 48 | 4 | ~192 | warp-level mma.sync |
~1 PFLOP |
The difference is not the popularly expressed “1 vs 4 tensor cores per SM” — by conventional counting, both architectures have 4 tensor cores per SM. The real difference comes from two sources: (a) SM count (148 active vs 48, ~3x) and (b) tensor core generation/programming model — SM100 has the 5th generation tcgen05 + TMEM infrastructure that dispatches with a single instruction, while SM121 only has the warp-level mma.sync path. When these two factors combine, FP4 peak compute power is ~1 PFLOP (SM121) vs ~9 PFLOP (SM100), approximately an order of magnitude (≈9x) difference. This difference particularly affects the prefill phase (compute-bound); it is directly related to the high TTFT (519ms) observed in NVFP4-MTP.
5. Memory bandwidth → 273 GB/s vs ~8 TB/s
| Architecture | Memory Type | Bandwidth |
|---|---|---|
| SM100 (B200) | HBM3e | ~8 TB/s |
| SM121 (DGX Spark) | LPDDR5x | 273 GB/s |
The bandwidth difference is ~29x. NVFP4’s 4-bit compression saves bandwidth on both platforms; however, DGX Spark’s low bandwidth causes the compute speedup to hit the bandwidth limit. In other words: NVFP4 carries less data than FP8 (4-bit vs 8-bit), but the 273 GB/s bandwidth is already so low that NVFP4’s compute advantage is lost under the bandwidth limit.
6. E2M1 activation quantization overhead
In W4A4 (weights and activations 4-bit) operating mode, NVFP4 requires activations to be converted from BF16 to E2M1 at runtime. On SM121, the cvt.rn.satfinite.e2m1x2.f32 PTX instruction can be used with the correct compile flags (sm_121a); however, vLLM v0.22.0’s CMake process does not pass these flags correctly (Section 6.4.4). When the hardware instruction is disabled, software conversion is required; this additional computational load slows down both the prefill and decode phases.
A.2 Theoretical vs Realized Speedup Analysis
NVFP4 halves the memory bandwidth requirement compared to FP8 by compressing weights to 4-bit. Since the decode phase is memory-bound, this theoretically promises ~2x speedup. However, actual performance:
| Platform | NVFP4 / FP8 TPS Ratio | Expected | Realized | Loss |
|---|---|---|---|---|
| SM121 (DGX Spark) [this report] | ~1.21x | ~2.0x | ~1.21x | ~40% |
On SM121, NVFP4 realizes only ~60% of the theoretical ~2x speedup (measured ~1.21x; loss ~40%). In this study, comparative measurement on data center Blackwell (SM100) was not performed; however, the SM121-specific hardware deficiencies documented in Section 6.4 (absence of TMEM, tcgen05, CTA Pairs and SMEM constraint) indicate that a significant portion of the loss is platform-specific. The breakdown of the loss is given estimatively in the table below.
Breakdown of the loss:
| Source | Estimated Contribution | Description |
|---|---|---|
| Low bandwidth (273 GB/s) | ~15% | NVFP4’s compute speedup hits bandwidth limit |
| SMEM constraint + tile reduction | ~8% | Low arithmetic intensity reduces bandwidth advantage |
| Fewer SM count (48 vs 148) | ~5% | Limits total FP4 capacity; directly affects prefill, indirectly decode |
| Lack of tcgen05 + TMEM + CTA Pairs | ~5% | Dispatch inefficiency + SM isolation (falling to warp-level mma.sync path) |
| E2M1 software conversion | ~3-5% | Additional computational load when not compiled correctly |
| Total | ~36-38% | Consistent with ≈40% loss |
Note: The percentages above are estimates and represent interrelated interactions that are difficult to isolate. The total is not a simple sum of individual contributions, but reflects their combined effects.
A.3 Achievable Ceiling with Software Improvements
If the software fixes listed in Section 6.4.4 (CMake suffix error, capability gate error, E2M1 software conversion, CUTLASS tile tuning, Marlin W4A16 backend) are applied:
| Scenario | NVFP4 / FP8 TPS Ratio | Improvement |
|---|---|---|
| Current (vLLM v0.22.0, unfixed) | ~1.21x | — |
| After software fixes applied (estimated) | ~1.30-1.40x | ~+8-19% |
| Theoretical ceiling (hardware limit) | ~1.30-1.40x | — |
Software improvements can raise NVFP4’s speedup ratio over FP8 from ~1.21x to ~1.30-1.40x. However, the lack of tcgen05, TMEM, and CTA Pairs creates a hardware-based ceiling that software improvements cannot exceed. Speedup of NVFP4 over FP8 beyond ~1.4x on SM121 is not possible due to these hardware deficiencies.
Comparison with AWQ-MTP — expectation after software fixes:
The ratio of AWQ-MTP, the speed winner in this report, to FP8-MTP is ~1.31x (25.45 / 19.50 tok/s). Since the predicted ~1.30-1.40x band for NVFP4 after software fixes covers and extends beyond this value, when all fixes are applied, NVFP4-MTP is expected to catch up to AWQ-MTP and likely surpass it by a small margin (estimate: 19.50 × 1.30-1.40 ≈ 25.4-27.3 tok/s vs AWQ-MTP 25.45 tok/s).
Three factors supporting this expectation:
- The difference has already closed at high concurrency: At C=16, total capacity NVFP4-MTP 231.5 vs AWQ-MTP 239.8 tok/s — even unpatched, the difference is only ~3.5% (Section 6.1). Since AWQ-MTP’s saturation index drops more steeply (59% vs NVFP4-MTP 69% at C=16, Section 6.2), NVFP4-MTP is the most likely candidate to take the lead under load.
- The known bugs in the NVFP4+MTP path are directly software-related: When the TTFT 519ms issue and MTP head loading constraint (Section 6.4.3-6.4.4) are fixed, an improvement area opens for NVFP4-MTP that has no counterpart on the AWQ side.
- Hardware-native path advantage: AWQ (W4A16) expands weights to BF16 with the Marlin kernel before computation; NVFP4 uses Blackwell’s native FP4 tensor core instruction (
mma.synce2m1). As kernel software matures, the difference tends to open in favor of the hardware-native format.
Nevertheless, the hardware ceiling in A.2 also applies here: on SM121, this transition should be expected at the level of parity or single-digit percentage advantage, not a major leap. Additionally, this comparison is speed-based only; the accuracy behavior of the two formats should be evaluated separately (Section 8.3).
Companion paper: The subsequent Qwen3.6-27B DGX Spark Cluster Scaling report extends this work to multi-node configurations (TP1/TP2/TP4) using a newer nightly vLLM image. Its TP1 (single-node) results for the same NVFP4 model differ from the NVFP4 baseline measured here; see §1.5 of that report for a side-by-side comparison of the two runtimes.
Appendix B: Variant-Based Charts
All charts are available in the respective variant directories:
| Variant | Directory |
|---|---|
| FP8 | Qwen3.6-27B-FP8/ |
| FP8-MTP | Qwen3.6-27B-FP8-MTP/ |
| AWQ-MTP | Qwen3.6-27B-AWQ-MTP/ |
| NVFP4 | Qwen3.6-27B-NVFP4/ |
| NVFP4-MTP | Qwen3.6-27B-NVFP4-MTP/ |
Each directory contains 5 PNG charts (TTFT, ITL, TPS, Latency, Throughput), 5 HTML interactive charts, and 1 CSV data file.
About Us — Openzeka
Openzeka Teknoloji A.Ş., founded in 2016 at Ankara Bilkent Cyberpark; is the official Embedded Compute distributor for NVIDIA in the Türkiye and MEA region and an NVIDIA Elite Partner. The company distributes NVIDIA DGX/HGX servers, data center and professional GPUs, Jetson embedded systems, and workstations for artificial intelligence and high-performance computing hardware; while offering real-time video analytics and AI inference solutions at edge and cloud environments with its self-developed Cordatus AI platform. With its expertise in deep learning-based artificial intelligence, digital twins, and digital transformation, it is one of the leading embedded AI providers in its region.
All measurements in this report were performed with Openzeka’s open source CordatusAI/llm-benchmark tool, on an NVIDIA DGX Spark (GB10) system.
| Web | openzeka.com |
| Contact | openzeka.com/iletisim |
| Phone | +90 312 266 2055 |
| Address | Üniversiteler Mah. 1606. Cad. No:11, Cyberpark H Blok, 06800 Bilkent / Ankara, Türkiye |
Report date: July 2026
Test platform: NVIDIA DGX Spark (GB10) · Model: Qwen3.6-27B
Prepared by: Openzeka Teknoloji A.Ş.